

Question: Using a spreadsheet, compute the average return and standard deviation of each of the three asset classes. Compute the annual return of a portfolio consisting
Using a spreadsheet, compute the average return and standard deviation of each of the three asset classes.
Compute the annual return of a portfolio consisting of 50% stocks, 40% real estate, and 10% gold. What are the average return and standard deviation of this portfolio? Also compute the average return and standard deviation of the following portfolios: 75%, 20%, and 5%; and 80%, 5%, and 15%. How do these portfolios perform compared to owning just stocks?
Choose an independent stock from the S&P 500, one that looks promising for you. What are its average return and standard deviation? Look up its Beta, and considering a market premium of 5.6% and a risk-free rate of 3.8%, what is its expected return? Use CAPM
Is this individual stock that you chose better than any of the portfolios from above? What other asset you could have picked to minimize risk? What are your conclusions on this?
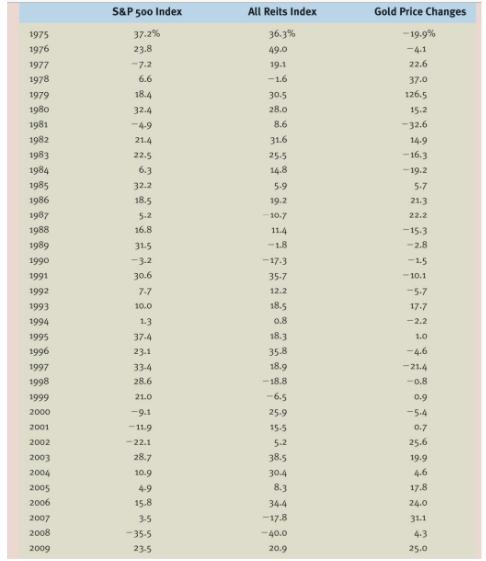
1975 1976 1977 1978 1979 1980 1981 1982 1983 1984 1985 1986 1987 1988 1989 1990 1991 1992 1993 1994 1995 1996 1997 1998 1999 2000 2001 2002 2003 2004 2005 2006 2007 2008 2009 S&P 500 Index 37.2% 23.8 -7-2 6.6 18.4 32.4 -4-9 21.4 22.5 6.3 32.2 18.5 5.2 16.8 31.5 -3-2 30.6 7-7 10.0 1.3 37-4 23.1 33-4 28.6 21.0 -9.1 -11.9
Step by Step Solution
3.41 Rating (167 Votes )
There are 3 Steps involved in it
Using a spreadsheet compute the average return and standard deviation of each of the three asset classes Stocks Average return 1125 Standard Deviation ... View full answer

Get step-by-step solutions from verified subject matter experts