

Question: Using all the data, find trial control limits for x and R charts, construct the chart, and plot the data. Is the process in
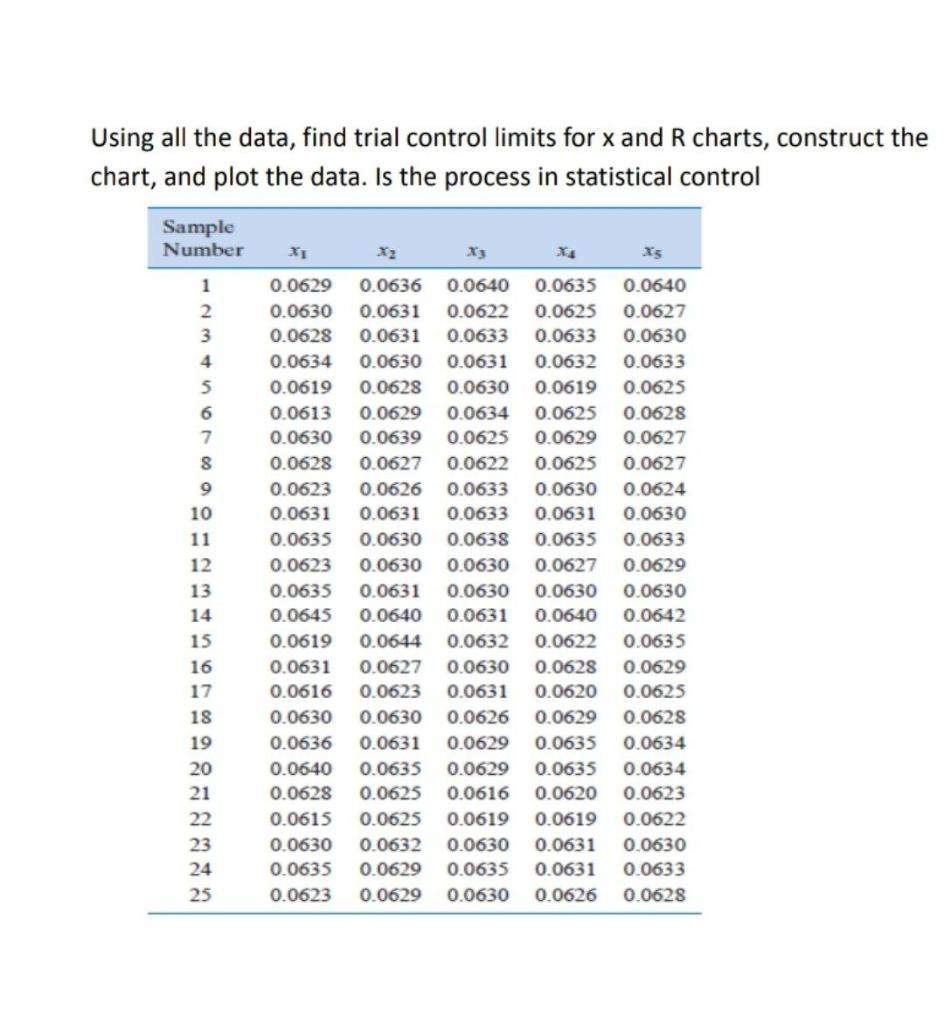
Using all the data, find trial control limits for x and R charts, construct the chart, and plot the data. Is the process in statistical control Sample Number X3 X5 1 0.0629 0.0636 0.0640 0.0635 0.0640 2 0.0630 0.0631 0.0625 0.0627 3 0.0622 0.0628 0.0631 0.0633 0.0633 0.0630 0.0634 0.0630 0.0631 0.0632 0.0633 0.0625 4 5 0.0619 0.0628 0.0630 0.0619 0.0629 0.0634 0.0625 0.0628 6 0.0613 7 0.0630 0.0639 0.0625 0.0629 0.0627 8 0.0628 0.0627 0.0625 0.0627 0.0622 0.0623 0.0626 0.0633 9 0.0630 0.0624 10 0.0631 0.0633 0.0631 0.0630 0.0631 0.0635 0.0630 0.0638 0.0635 11 0.0633 12 0.0623 0.0630 0.0630 0.0627 0.0629 0.0635 0.0631 0.0630 0.0630 0.0630 13 14 0.0642 0.0645 0.0640 0.0631 0.0640 0.0619 0.0644 0.0632 0.0622 15 0.0635 16 0.0631 0.0627 0.0630 0.0628 0.0629 17 0.0616 0.0623 0.0631 0.0620 0.0625 18 0.0630 0.0626 0.0629 0.0628 0.0630 0.0636 0.0631 0.0629 19 0.0635 0.0634 20 0.0640 0.0635 0.0629 0.0635 0.0634 21 0.0628 0.0625 0.0616 0.0620 0.0623 22 0.0615 0.0625 0.0619 0.0619 0.0622 23 0.0630 0.0632 0.0630 0.0631 0.0630 24 0.0633 0.0635 0.0629 0.0635 0.0631 0.0623 0.0629 0.0630 0.0626 0.0628 25
Step by Step Solution
3.40 Rating (147 Votes )
There are 3 Steps involved in it
XBar chart Using values from XbarLCLCL and UCL let us draw Xbar ch... View full answer

Get step-by-step solutions from verified subject matter experts