

Question: The following data were considered in Quality Engineering [An SPC Case Study on Stabilizing Syringe Lengths (19992000, Vol. 12(1))]. The syringe length is measured during
The following data were considered in Quality Engineering [€œAn SPC Case Study on Stabilizing Syringe Lengths€ (1999€“2000, Vol. 12(1))]. The syringe length is measured during a pharmaceutical manufacturing process. The following table provides data (in inches) for 20 samples each of size 5.
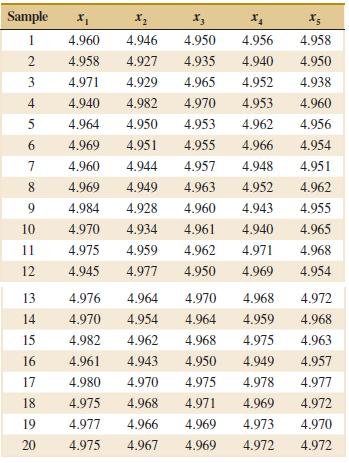
(a) Using all the data, find trial control limits for X and R charts, construct the chart, and plot the data. Is this process in statistical control?
(b) Use the trial control limits from part (a) to identify out-of- control points. If necessary, revise your control limits assuming that any samples that plot outside the control limits can be eliminated.
(c) Repeat parts (a) and (b) for XÌ… and S charts.
Sample X3 4.960 4.946 4.950 4.956 4.958 4.940 2 4.958 4.927 4.935 4.950 4.929 3 4.971 4.965 4.952 4.938 4.940 4.982 4.970 4.953 4.960 4.953 4.962 5 4.964 4.950 4.956 4.969 4.954 6. 4.951 4.955 4.966 4.957 4.960 4.944 4.948 4.951 4.963 4.952 4.962 8. 4.969 4.949 9. 4.984 4.928 4.960 4.943 4.955 10 4.970 4.934 4.961 4.940 4.965 4.968 11 4.975 4.959 4.962 4.971 4.950 12 4.945 4.977 4.969 4.954
Step by Step Solution
3.38 Rating (154 Votes )
There are 3 Steps involved in it
a The average range is used to estimate the standard devia... View full answer

Get step-by-step solutions from verified subject matter experts