

Question: Using an Excel spreadsheet, reconstruct the reaction velocity vs. substrate concentration graph. (10 pts) A Lineweaver-Burk plot determined an equation for the trendline linear curve
Using an Excel spreadsheet, reconstruct the reaction velocity vs. substrate concentration graph. 
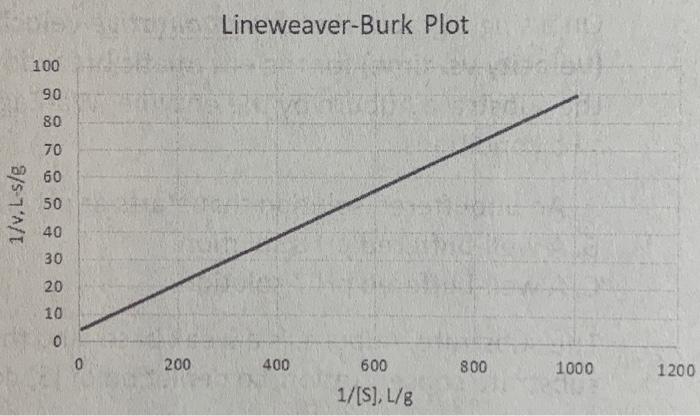
(10 pts) A Lineweaver-Burk plot determined an equation for the trendline linear curve fit to be y = 0.0853 +4.25 for isomerization of glucose using glucose isomerase. Using a spreadsheet (computer), reconstruct the reaction velocity vs. substrate concentration graph. Be sure to include units on your graph. Lineweaver-Burk Plot 100 90 80 70 60 1/v, L-s/g 50 40 30 20 10 0 0 200 400 800 1000 1200 600 1/[S], L/8
Step by Step Solution
There are 3 Steps involved in it
1 Expert Approved Answer
Step: 1 Unlock

Question Has Been Solved by an Expert!
Get step-by-step solutions from verified subject matter experts
Step: 2 Unlock
Step: 3 Unlock