

Question: please help answer as soon as possible. this question contains a,b, c and d. since this is in one question, please help answer. thank you
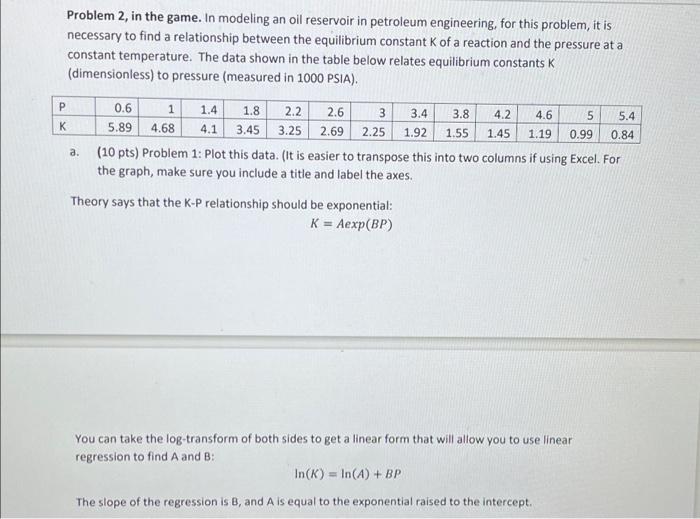
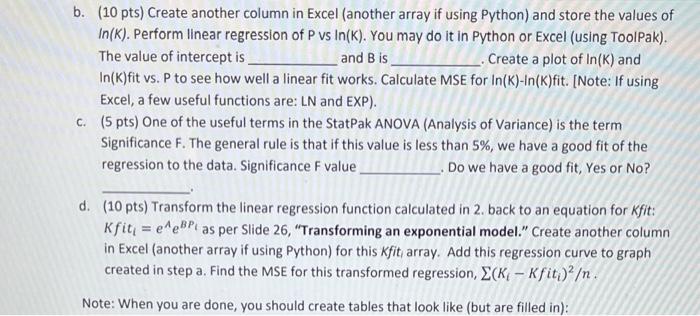
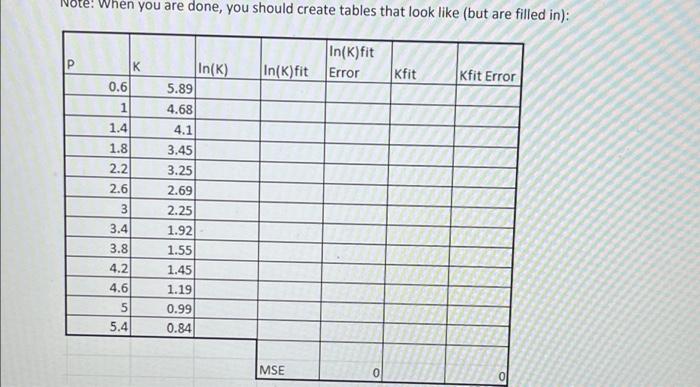
Problem 2, in the game. In modeling an oil reservoir in petroleum engineering, for this problem, it is necessary to find a relationship between the equilibrium constant K of a reaction and the pressure at a constant temperature. The data shown in the table below relates equilibrium constants K (dimensionless) to pressure (measured in 1000 PSIA). P 0.6 1 a. 1.4 1.8 2.2 2.6 3 3.4 3.8 4.2 4.6 5 5.4 5.89 4.68 4.1 3.45 3.25 2.69 2.25 1.92 1.55 1.45 1.19 0.99 0.84 (10 pts) Problem 1: Plot this data. (it is easier to transpose this into two columns if using Excel. For the graph, make sure you include a title and label the axes. Theory says that the K-P relationship should be exponential: K = Aexp(BP) You can take the log-transform of both sides to get a linear form that will allow you to use linear regression to find A and B: In(K) = In(A) + BP The slope of the regression is B, and A is equal to the exponential raised to the intercept. b. (10 pts) Create another column in Excel (another array if using Python) and store the values of In(K). Perform linear regression of P vs In(K). You may do it in Python or Excel (using ToolPak). The value of intercept is. and B is Create a plot of In(K) and In(K)fit vs. P to see how well a linear fit works. Calculate MSE for In(K)-In(K)fit. (Note: If using Excel, a few useful functions are: LN and EXP). c. (5 pts) One of the useful terms in the StatPak ANOVA (Analysis of Variance) is the term Significance F. The general rule is that if this value is less than 5%, we have a good fit of the regression to the data. Significance F value Do we have a good fit, Yes or No? d. (10 pts) Transform the linear regression function calculated in 2. back to an equation for Kfit: Kfit; = eeBPl as per Slide 26, "Transforming an exponential model." Create another column in Excel (another array if using Python) for this kfit array. Add this regression curve to graph created in step a. Find the MSE for this transformed regression, ECK - kfiti)?. om: 20 Note: When you are done, you should create tables that look like (but are filled in): Note: When you are done, you should create tables that look like (but are filled in): P K In(K)fit In(K)fit Error Kfit Kfit Error 0 0.6 1 1.4 1 1.8 2.2 2.6 In(K) 5.89 4.68 4.1 3.45 3.25 2.69 2.25 1.92 1.55 1.45 1.19 0.99 0.84 3 3.4 3.8 4.2. 4.6 5 5.4 5 MSE 0 0
Step by Step Solution
There are 3 Steps involved in it

Get step-by-step solutions from verified subject matter experts