

Question: Using average value, calculate TWO (2) relevant financial ratios for each of the following areas that are useful in determining the overall performance of the
- Using average value, calculate TWO (2) relevant financial ratios for each of the following areas that are useful in determining the overall performance of the company for 2019 and 2018.
- Ability to meet short term maturing financial obligations.
- Effectiveness in managing assets and efficiency in handling operations
- Profitability and overall operating results
- Ability to service debt and the degree of financial risk
- ROE using the DuPont Method
- Based on your calculations in (a), (b) and the index trend financial data, prepare a report that reveals the overall performance of the company for the financial years 2019 and 2018.
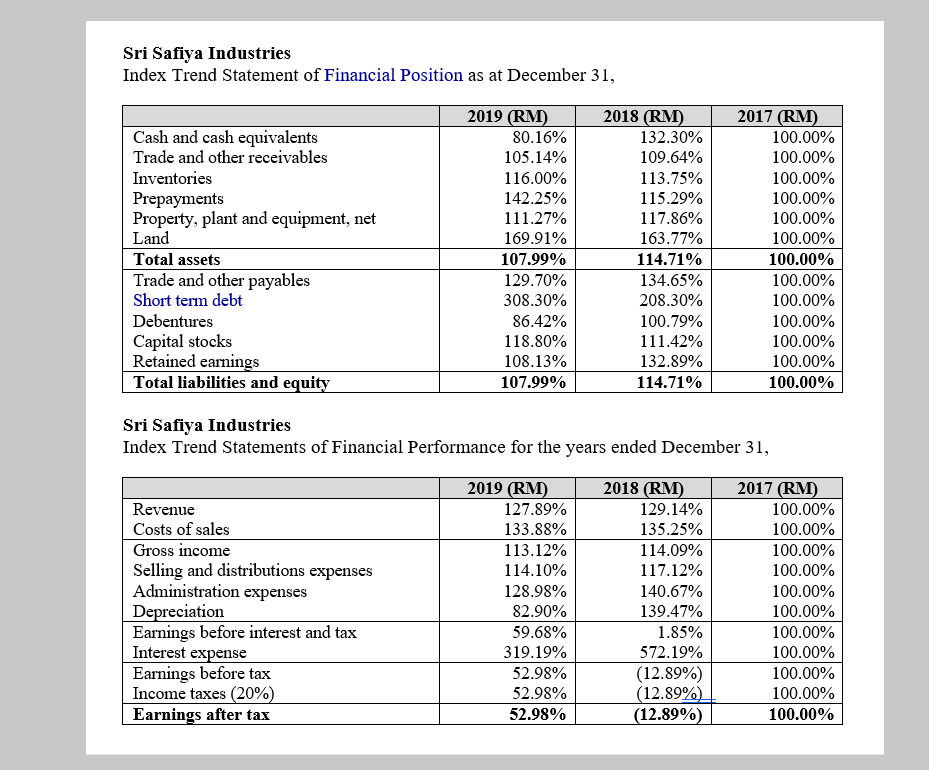
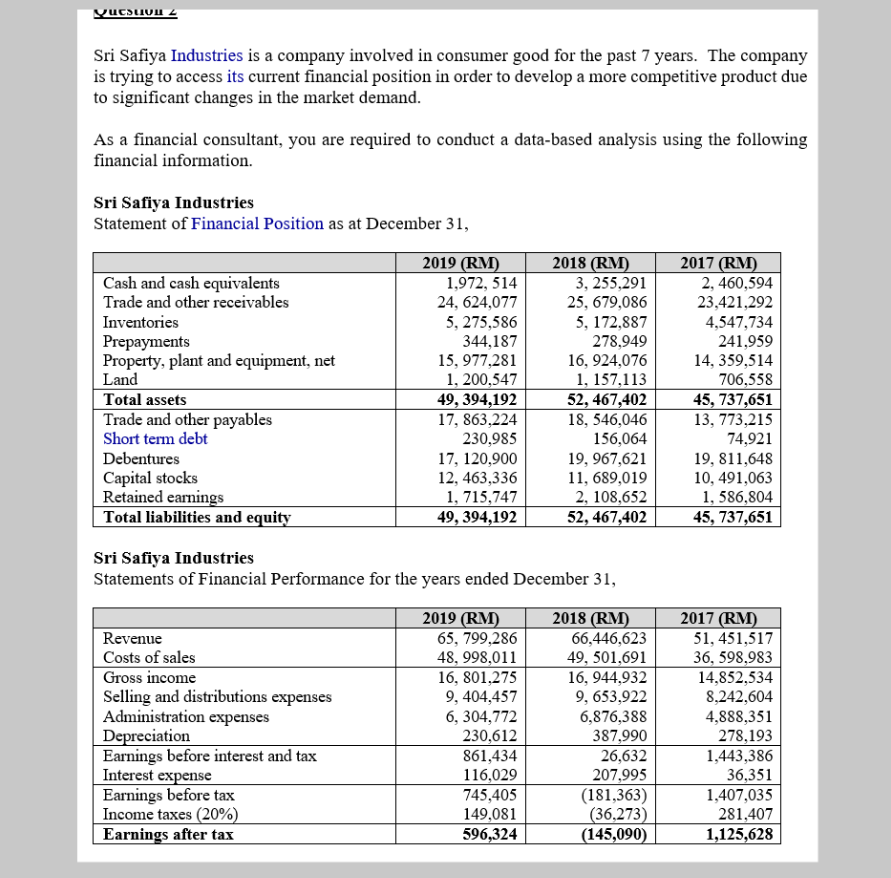
Sri Safiya Industries Index Trend Statement of Financial Position as at December 31, Cash and cash equivalents Trade and other receivables Inventories Prepayments Property, plant and equipment, net Land Total assets Trade and other payables Short term debt Debentures Capital stocks Retained earnings Total liabilities and equity 2019 (RM) 80.16% 105.14% 116.00% 142.25% 111.27% 169.91% 107.99% 129.70% 308.30% 86.42% 118.80% 108.13% 107.99% 2018 (RM) 132.30% 109.64% 113.75% 115.29% 117.86% 163.77% 114.71% 134.65% 208.30% 100.79% 111.42% 132.89% 114.71% 2017 (RM) 100.00% 100.00% 100.00% 100.00% 100.00% 100.00% 100.00% 100.00% 100.00% 100.00% 100.00% 100.00% 100.00% Sri Safiya Industries Index Trend Statements of Financial Performance for the years ended December 31, Revenue Costs of sales Gross income Selling and distributions expenses Administration expenses Depreciation Earnings before interest and tax Interest expense Earnings before tax Income taxes (20%) Earnings after tax 2019 (RM) 127.89% 133.88% 113.12% 114.10% 128.98% 82.90% 59.68% 319.19% 52.98% 52.98% 52.98% 2018 (RM) 129.14% 135.25% 114.09% 117.12% 140.67% 139.47% 1.85% 572.19% (12.89%) (12.89%) (12.89%) 2017 (RM) 100.00% 100.00% 100.00% 100.00% 100.00% 100.00% 100.00% 100.00% 100.00% 100.00% 100.00% yucsuvu Sri Safiya Industries is a company involved in consumer good for the past 7 years. The company is trying to access its current financial position in order to develop a more competitive product due to significant changes in the market demand. As a financial consultant, you are required to conduct a data-based analysis using the following financial information. Sri Safiya Industries Statement of Financial Position as at December 31, Cash and cash equivalents Trade and other receivables Inventories Prepayments Property, plant and equipment, net Land Total assets Trade and other payables Short term debt Debentures Capital stocks Retained earnings Total liabilities and equity 2019 (RM) 1,972, 514 24, 624,077 5, 275,586 344.187 15, 977,281 1, 200,547 49, 394,192 17,863,224 230,985 17, 120,900 12, 463,336 1, 715,747 49, 394,192 2018 (RM) 3, 255,291 25, 679,086 5, 172,887 278,949 16, 924,076 1, 157,113 52,467,402 18, 546,046 156,064 19,967,621 11, 689,019 2, 108,652 52, 467,402 2017 (RM) 2, 460,594 23,421,292 4,547,734 241,959 14, 359,514 706,558 45, 737,651 13, 773,215 74,921 19, 811,648 10, 491,063 1,586,804 45, 737,651 Sri Safiya Industries Statements of Financial Performance for the years ended December 31, Revenue Costs of sales Gross income Selling and distributions expenses Administration expenses Depreciation Earnings before interest and tax Interest expense Earnings before tax Income taxes (20%) Earnings after tax 2019 (RM) 65, 799,286 48, 998,011 16, 801,275 9, 404,457 6, 304,772 230,612 861,434 116,029 745,405 149,081 596,324 2018 (RM) 66,446,623 49, 501,691 16, 944,932 9, 653,922 6,876,388 387,990 26,632 207,995 (181,363) (36,273) (145,090) 2017 (RM) 51, 451,517 36, 598,983 14,852,534 8,242,604 4,888,351 278,193 1,443,386 36,351 1,407,035 281,407 1,125,628 Sri Safiya Industries Index Trend Statement of Financial Position as at December 31, Cash and cash equivalents Trade and other receivables Inventories Prepayments Property, plant and equipment, net Land Total assets Trade and other payables Short term debt Debentures Capital stocks Retained earnings Total liabilities and equity 2019 (RM) 80.16% 105.14% 116.00% 142.25% 111.27% 169.91% 107.99% 129.70% 308.30% 86.42% 118.80% 108.13% 107.99% 2018 (RM) 132.30% 109.64% 113.75% 115.29% 117.86% 163.77% 114.71% 134.65% 208.30% 100.79% 111.42% 132.89% 114.71% 2017 (RM) 100.00% 100.00% 100.00% 100.00% 100.00% 100.00% 100.00% 100.00% 100.00% 100.00% 100.00% 100.00% 100.00% Sri Safiya Industries Index Trend Statements of Financial Performance for the years ended December 31, Revenue Costs of sales Gross income Selling and distributions expenses Administration expenses Depreciation Earnings before interest and tax Interest expense Earnings before tax Income taxes (20%) Earnings after tax 2019 (RM) 127.89% 133.88% 113.12% 114.10% 128.98% 82.90% 59.68% 319.19% 52.98% 52.98% 52.98% 2018 (RM) 129.14% 135.25% 114.09% 117.12% 140.67% 139.47% 1.85% 572.19% (12.89%) (12.89%) (12.89%) 2017 (RM) 100.00% 100.00% 100.00% 100.00% 100.00% 100.00% 100.00% 100.00% 100.00% 100.00% 100.00% yucsuvu Sri Safiya Industries is a company involved in consumer good for the past 7 years. The company is trying to access its current financial position in order to develop a more competitive product due to significant changes in the market demand. As a financial consultant, you are required to conduct a data-based analysis using the following financial information. Sri Safiya Industries Statement of Financial Position as at December 31, Cash and cash equivalents Trade and other receivables Inventories Prepayments Property, plant and equipment, net Land Total assets Trade and other payables Short term debt Debentures Capital stocks Retained earnings Total liabilities and equity 2019 (RM) 1,972, 514 24, 624,077 5, 275,586 344.187 15, 977,281 1, 200,547 49, 394,192 17,863,224 230,985 17, 120,900 12, 463,336 1, 715,747 49, 394,192 2018 (RM) 3, 255,291 25, 679,086 5, 172,887 278,949 16, 924,076 1, 157,113 52,467,402 18, 546,046 156,064 19,967,621 11, 689,019 2, 108,652 52, 467,402 2017 (RM) 2, 460,594 23,421,292 4,547,734 241,959 14, 359,514 706,558 45, 737,651 13, 773,215 74,921 19, 811,648 10, 491,063 1,586,804 45, 737,651 Sri Safiya Industries Statements of Financial Performance for the years ended December 31, Revenue Costs of sales Gross income Selling and distributions expenses Administration expenses Depreciation Earnings before interest and tax Interest expense Earnings before tax Income taxes (20%) Earnings after tax 2019 (RM) 65, 799,286 48, 998,011 16, 801,275 9, 404,457 6, 304,772 230,612 861,434 116,029 745,405 149,081 596,324 2018 (RM) 66,446,623 49, 501,691 16, 944,932 9, 653,922 6,876,388 387,990 26,632 207,995 (181,363) (36,273) (145,090) 2017 (RM) 51, 451,517 36, 598,983 14,852,534 8,242,604 4,888,351 278,193 1,443,386 36,351 1,407,035 281,407 1,125,628
Step by Step Solution
There are 3 Steps involved in it

Get step-by-step solutions from verified subject matter experts