

Question: Using Business School Ranking data set, Eli ran a regression model to identify factors that drive the change in salary (i.e., salary difference between post-
Using Business School Ranking data set, Eli ran a regression model to identify factors that drive the change in salary (i.e., salary difference between post- and pre-program; in $). Specifically, he regressed the change in salary on Anlys (How good are the MBAs analytic skills?; 1 best to 6 worst), Team (How well do MBAs do within teams?; 1 best to 6 worst), Globe (How global is the education; 1 best to 6 worst), and Tuition (in $). Use Table 1A and 1B to answer to the question.
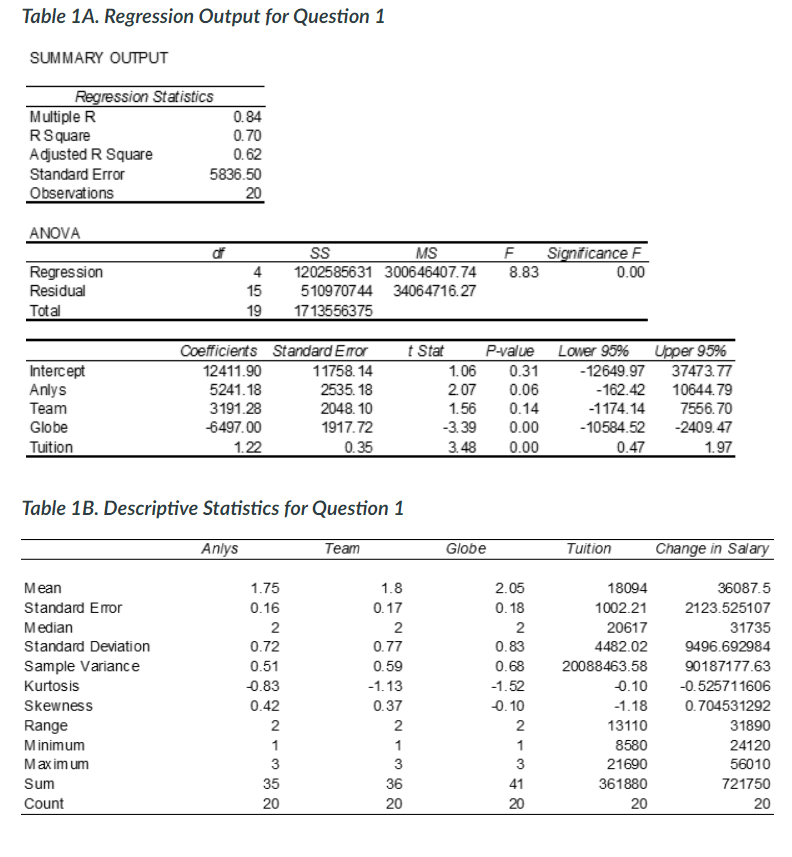
(1) What factors influence the change in salary? Provide a specific rationale behind your conclusion
(2) Explain the relative importance of the regressors. Why can/cant you compare the relative importance?
(3) Based on these results, what advice would you give to the program directors? Please provide specific guidance
Table 1A. Regression Output for Question 1 SUMMARY OUTPUT Regression Statistics Multiple R 0.84 R Square Adjusted R Square 0.62 Standard Error 5836.50 Observations 20 0.70 ANOVA of F 8.83 Significance F 0.00 Regression Residual Total 4 15 19 SS MS 1202585631 300646407.74 510970744 34064716.27 1713556375 Intercept Anlys Team Globe Tuition Coefficients Standard Error 12411.90 11758. 14 5241.18 2535.18 3191.28 2048.10 6497.00 1917.72 1.22 0.35 t Stat 1.06 2.07 1.56 -3.39 3.48 P-value 0.31 0.06 0.14 0.00 0.00 Lower 95% Upper 95% - 12649.97 37473.77 - 162.42 10644.79 -1174.14 7556.70 - 10584.52 -2409.47 0.47 1.97 Table 1B. Descriptive Statistics for Question 1 Anlys Team Globe Tuition Change in Salary Mean Standard Error Median Standard Deviation Sample Variance Kurtosis Skewness Range Minimum Maximum Sum Count 1.75 0.16 2. 0.72 0.51 -0.83 0.42 2 1 3 35 20 1.8 0.17 2 0.77 0.59 -1.13 0.37 2 1 3 36 20 2.05 0.18 2. 0.83 0.68 -1.52 0.10 2 1 3 41 20 18094 1002.21 20617 4482.02 20088463.58 0.10 -1.18 13110 8580 21690 361880 20 36087.5 2123.525107 31735 9496.692984 90187177.63 -0.525711606 0.704531292 31890 24120 56010 721750 20 Table 1A. Regression Output for Question 1 SUMMARY OUTPUT Regression Statistics Multiple R 0.84 R Square Adjusted R Square 0.62 Standard Error 5836.50 Observations 20 0.70 ANOVA of F 8.83 Significance F 0.00 Regression Residual Total 4 15 19 SS MS 1202585631 300646407.74 510970744 34064716.27 1713556375 Intercept Anlys Team Globe Tuition Coefficients Standard Error 12411.90 11758. 14 5241.18 2535.18 3191.28 2048.10 6497.00 1917.72 1.22 0.35 t Stat 1.06 2.07 1.56 -3.39 3.48 P-value 0.31 0.06 0.14 0.00 0.00 Lower 95% Upper 95% - 12649.97 37473.77 - 162.42 10644.79 -1174.14 7556.70 - 10584.52 -2409.47 0.47 1.97 Table 1B. Descriptive Statistics for Question 1 Anlys Team Globe Tuition Change in Salary Mean Standard Error Median Standard Deviation Sample Variance Kurtosis Skewness Range Minimum Maximum Sum Count 1.75 0.16 2. 0.72 0.51 -0.83 0.42 2 1 3 35 20 1.8 0.17 2 0.77 0.59 -1.13 0.37 2 1 3 36 20 2.05 0.18 2. 0.83 0.68 -1.52 0.10 2 1 3 41 20 18094 1002.21 20617 4482.02 20088463.58 0.10 -1.18 13110 8580 21690 361880 20 36087.5 2123.525107 31735 9496.692984 90187177.63 -0.525711606 0.704531292 31890 24120 56010 721750 20
Step by Step Solution
There are 3 Steps involved in it

Get step-by-step solutions from verified subject matter experts