

Question: Using the Business School Ranking data set, Eli ran a regression model to identify factors that drive the change in salary (i.e., salary difference between
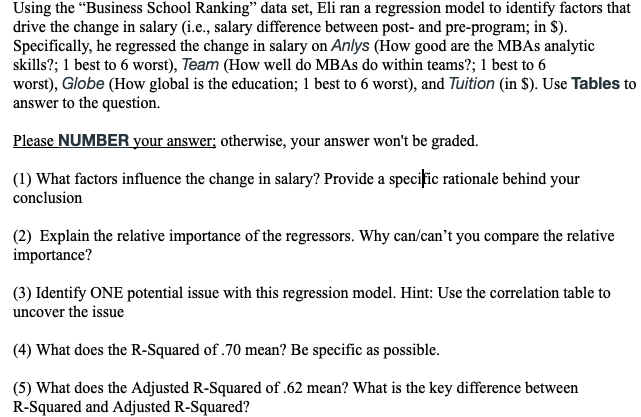
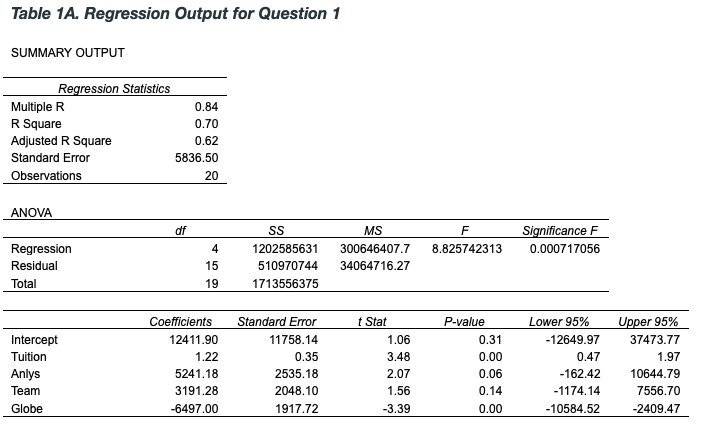
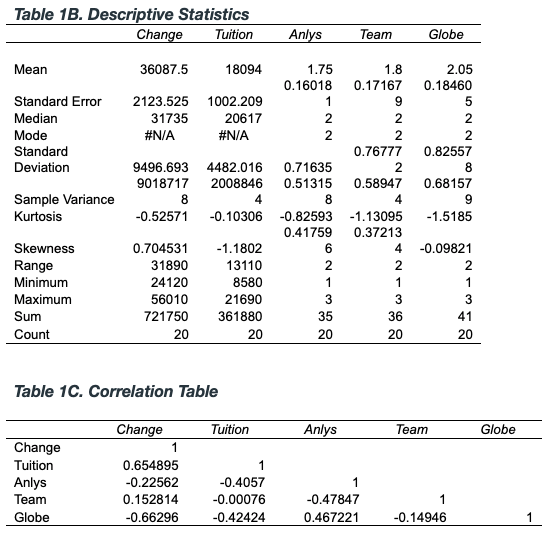
Using the "Business School Ranking" data set, Eli ran a regression model to identify factors that drive the change in salary (i.e., salary difference between post- and pre-program; in $). Specifically, he regressed the change in salary on Anlys (How good are the MBAs analytic skills?; 1 best to 6 worst), Team (How well do MBAs do within teams?; 1 best to 6 worst), Globe (How global is the education; 1 best to 6 worst), and Tuition (in $). Use Tables to answer to the question. Please NUMBER your answer; otherwise, your answer won't be graded. (1) What factors influence the change in salary? Provide a specific rationale behind your conclusion (2) Explain the relative importance of the regressors. Why can/can't you compare the relative importance? (3) Identify ONE potential issue with this regression model. Hint: Use the correlation table to uncover the issue (4) What does the R-Squared of .70 mean? Be specific as possible. (5) What does the Adjusted R-Squared of .62 mean? What is the key difference between R-Squared and Adjusted R-Squared?Table 1A. Regression Output for Question 1 SUMMARY OUTPUT Regression Statistics Multiple R 0.84 R Square 0.70 Adjusted R Square 0.62 Standard Error 5836.50 Observations 20 ANOVA of SS MS F Significance F Regression 4 1202585631 300646407.7 8.825742313 0.000717056 Residual 15 510970744 34064716.27 Total 19 1713556375 Coefficients Standard Error t Stat P-value Lower 95% Upper 95% Intercept 12411.90 11758.14 1.06 0.31 -12649.97 37473.77 Tuition 1.22 0.35 3.48 0.00 0.47 1.97 Anlys 5241.18 2535.18 2.07 0.06 -162.42 10644.79 Team 3191.28 2048.10 1.56 0.14 -1174.14 7556.70 Globe -6497.00 1917.72 -3.39 0.00 -10584.52 -2409.47Table 1B. Descriptive Statistics Change Tuition Anlys Team Globe Mean 36087.5 18094 1.75 1.8 2.05 0.16018 0.17167 0.18460 Standard Error 2123.525 1002.209 9 5 Median 31735 20617 N N - 2 2 Mode #N/A #N/A N N Standard 0.76777 0.82557 Deviation 9496.693 4482.016 0.71635 2 9018717 2008846 0.51315 0.58947 0.68157 Sample Variance 8 4 8 4 9 Kurtosis -0.52571 -0.10306 -0.82593 -1.13095 -1.5185 0.41759 0.37213 Skewness 0.704531 -1.1802 6 4 -0.09821 Range 31890 13110 N IN Minimum 24120 8580 1 1 Maximum 56010 21690 3 3 Sum 721750 361880 35 36 41 Count 20 20 20 20 20 Table 1C. Correlation Table Change Tuition Anlys Team Globe Change 1 Tuition 0.654895 Anlys -0.22562 -0.4057 Team 0.152814 -0.00076 -0.47847 1 Globe -0.66296 -0.42424 0.467221 -0.14946
Step by Step Solution
There are 3 Steps involved in it

Get step-by-step solutions from verified subject matter experts