

Question: Using Data Analytics to Analyze Data DA17.2 Data analytics can be used to understand return on investment. Problem Valencia Canseco was recently promoted to division
Using Data Analytics to Analyze Data DA17.2 Data analytics can be used to understand return on investment. Problem Valencia Canseco was recently promoted to division director of the East Division of the Bamboo Towels, Inc., the company at which she is employed. Because Valencia is able to control revenues, expenses, and the return on the invested plant assets, she will now be evaluated on the division's return on investment. She wants to examine three possible scenarios each with a change in a different factor that may affect the East Division's return investment. The scenarios, each with a change in either operating income, sales, and the invested capital, holding two of the variables constant in each scenario. Current operating income, sales, and invested assets with possible changes CaseOperating IncomeSalesInvested AssetsChange in VariableType of Change A$ 50,000 $ 1,000,000 $ 800,000 $ 10,000 Increase in operating income B50,000 1,000,000 800,000 100,000 Increase in sales revenue C50,000 1,000,000 800,000 50,000 Increase in invested assets Instructions There are five parts to this problem. Use Excel to perform the following. a.For Case A, create a table with operating income ranging from $50,000 to $140,000 in the increments indicated in the data, with columns for the three variables, return on sales, investment turnover, and ROI. b.For Case B, create a table with sales revenue ranging from $1,000,000 to $1,900,000 in the increments indicated in the data, with columns for the three variables, return on sales, investment turnover, and ROI. c.For Case C, create a table with invested assets ranging from $800,000 to $1,250,000 in the increments indicated in the data, with columns for the three variables, return on sales, investment turnover, and ROI. d.Create a combo chart for each case with investment turnover in columns on the primary axis, and with ROI and return of sales as separate lines on the secondary axis. Include a descriptive chart title, chart legend, axes labels, and properly formatted axes in the charts. e.Provide Valencia advice on how to best improve ROI.
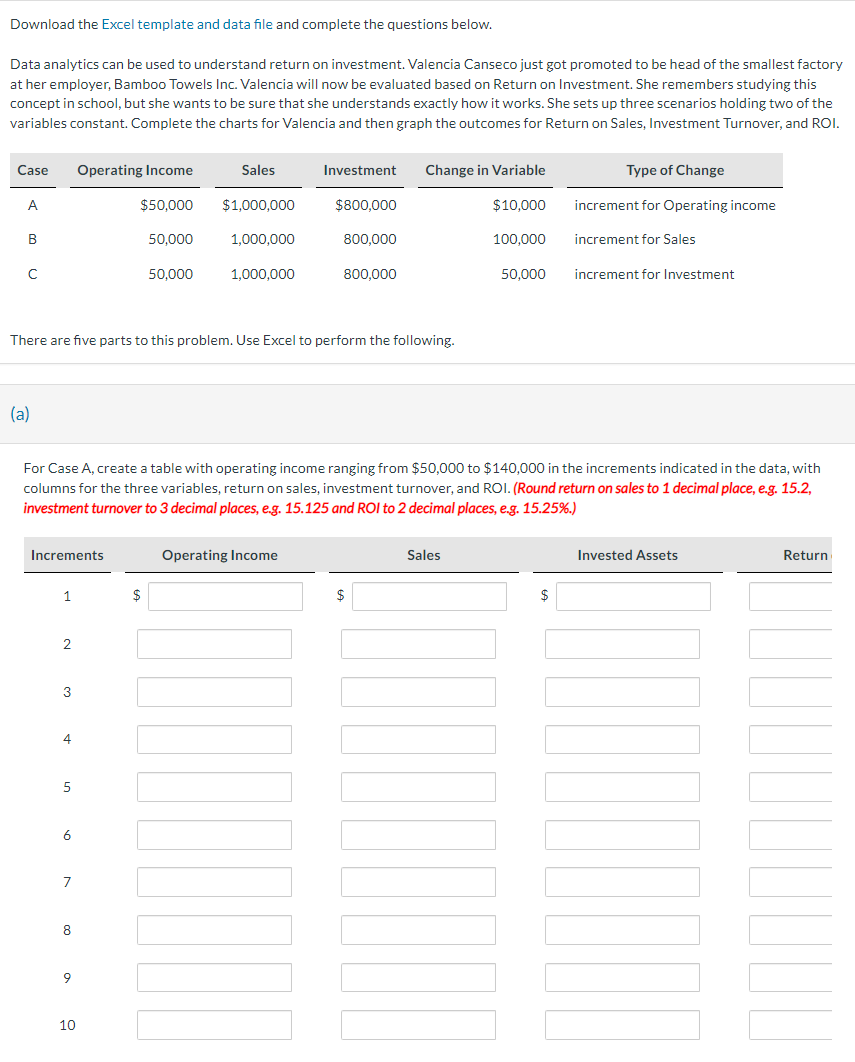
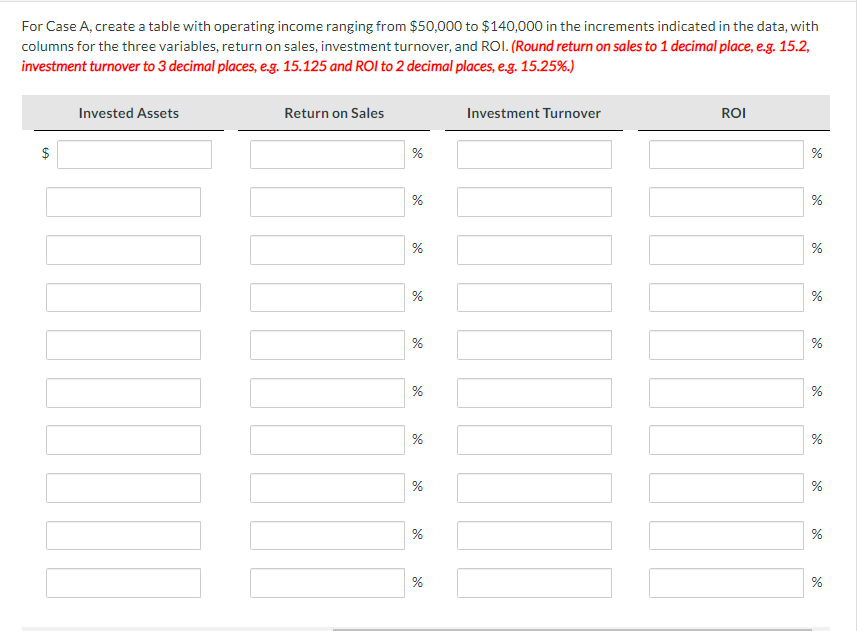
Download the Excel template and data file and complete the questions below. Data analytics can be used to understand return on investment. Valencia Canseco just got promoted to be head of the smallest factory at her employer, Bamboo Towels Inc. Valencia will now be evaluated based on Return on Investment. She remembers studying this concept in school, but she wants to be sure that she understands exactly how it works. She sets up three scenarios holding two of the variables constant. Complete the charts for Valencia and then graph the outcomes for Return on Sales, Investment Turnover, and ROI. There are five parts to this problem. Use Excel to perform the following. (a) For Case A, create a table with operating income ranging from \\( \\$ 50,000 \\) to \\( \\$ 140,000 \\) in the increments indicated in the data, with columns for the three variables, return on sales, investment turnover, and ROI. (Round return on sales to 1 decimal place, e.g. 15.2, investment turnover to 3 decimal places, e.g. 15.125 and \\( R O I \\) to 2 decimal places, e.g. 15.25\\%.) For Case \\( A \\), create a table with operating income ranging from \\( \\$ 50,000 \\) to \\( \\$ 140,000 \\) in the increments indicated in the data, with columns for the three variables, return on sales, investment turnover, and ROI. (Round return on sales to 1 decimal place, e.g. 15.2, investment turnover to 3 decimal places, e.g. 15.125 and ROI to 2 decimal places, e.g. 15.25\\%.) Download the Excel template and data file and complete the questions below. Data analytics can be used to understand return on investment. Valencia Canseco just got promoted to be head of the smallest factory at her employer, Bamboo Towels Inc. Valencia will now be evaluated based on Return on Investment. She remembers studying this concept in school, but she wants to be sure that she understands exactly how it works. She sets up three scenarios holding two of the variables constant. Complete the charts for Valencia and then graph the outcomes for Return on Sales, Investment Turnover, and ROI. There are five parts to this problem. Use Excel to perform the following. (a) For Case A, create a table with operating income ranging from \\( \\$ 50,000 \\) to \\( \\$ 140,000 \\) in the increments indicated in the data, with columns for the three variables, return on sales, investment turnover, and ROI. (Round return on sales to 1 decimal place, e.g. 15.2, investment turnover to 3 decimal places, e.g. 15.125 and \\( R O I \\) to 2 decimal places, e.g. 15.25\\%.) For Case \\( A \\), create a table with operating income ranging from \\( \\$ 50,000 \\) to \\( \\$ 140,000 \\) in the increments indicated in the data, with columns for the three variables, return on sales, investment turnover, and ROI. (Round return on sales to 1 decimal place, e.g. 15.2, investment turnover to 3 decimal places, e.g. 15.125 and ROI to 2 decimal places, e.g. 15.25\\%.)
Step by Step Solution
There are 3 Steps involved in it

Get step-by-step solutions from verified subject matter experts