

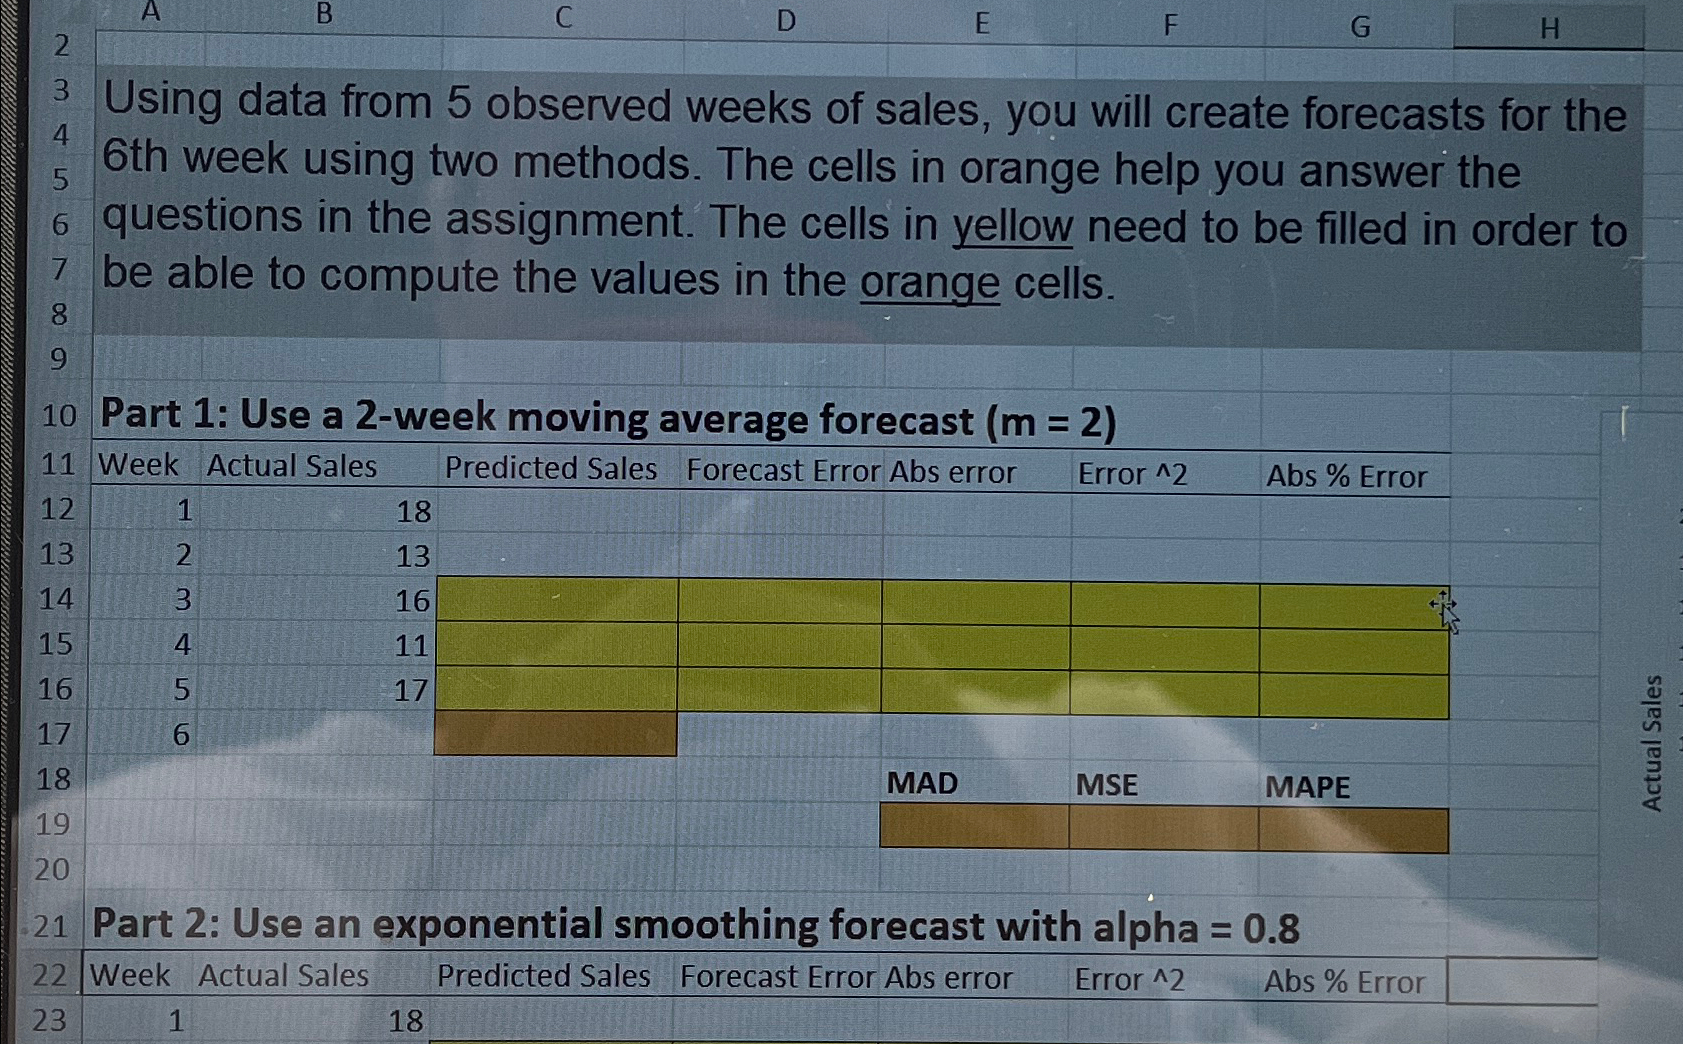
Question: Using data from 5 observed weeks of sales, you will create forecasts for the 6 th week using two methods. The cells in orange help
Using data from observed weeks of sales, you will create forecasts for the th week using two methods. The cells in orange help you answer the questions in the assignment. The cells in yellow need to be filled in order to be able to compute the values in the orange cells.
Part : Use a week moving average forecast
tableWeekActual Sales,Predicted Sales,Forecast Error Abs error,Error Abs ErrorMAD,MSE,MAPE
Part : Use an exponential smoothing forecast with alpha
Week Actual Sales Predicted Sales Forecast Error Abs error Error Abs Error
Step by Step Solution
There are 3 Steps involved in it
1 Expert Approved Answer
Step: 1 Unlock

Question Has Been Solved by an Expert!
Get step-by-step solutions from verified subject matter experts
Step: 2 Unlock
Step: 3 Unlock