

Question: Using data from 50 workers, a researcher estimates Wage - B9 + 81 Education + 82Experience + B3Age + E, where Wage is the hourly
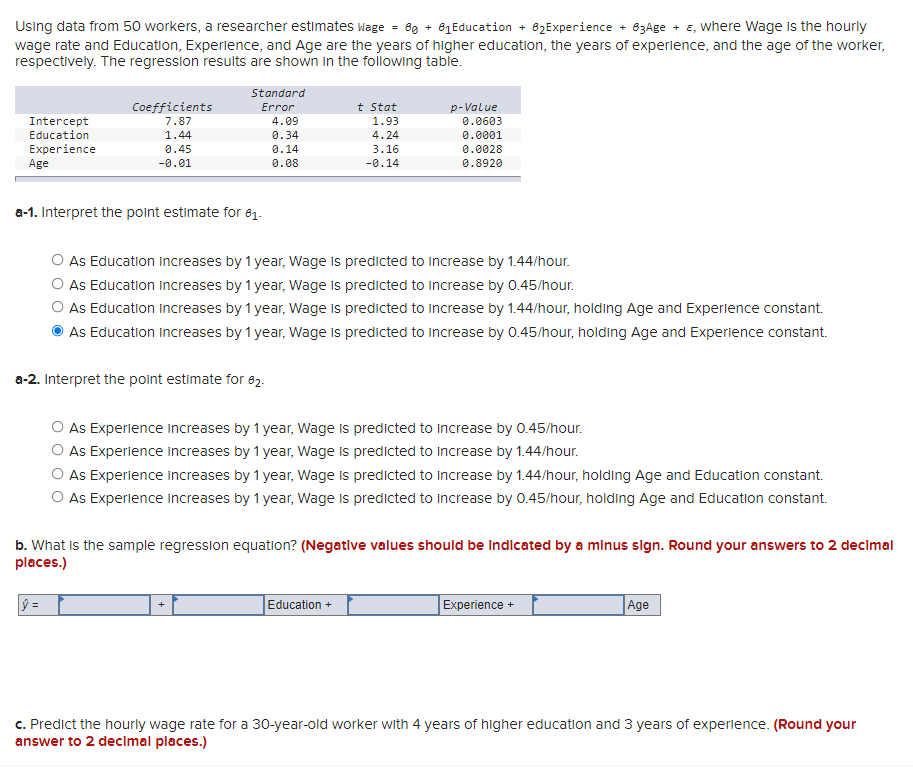
Using data from 50 workers, a researcher estimates Wage - B9 + 81 Education + 82Experience + B3Age + E, where Wage is the hourly wage rate and Education, Experience, and Age are the years of higher education, the years of experience, and the age of the worker, respectively. The regression results are shown in the following table. Intercept Education Experience Age Coefficients 7.87 1.44 0.45 -0.01 Standard Error 4.09 0.34 0.14 0.08 t Stat 1.93 4.24 3.16 -0.14 p-Value 0.0603 0.0001 0.0028 0.8920 a-1. Interpret the point estimate for 81- As Education Increases by 1 year, Wage is predicted to increase by 1.44/hour. O As Education increases by 1 year, Wage is predicted to increase by 0.45/hour. As Education increases by 1 year, Wage is predicted to increase by 1.44/hour, holding Age and Experience constant. As Education increases by 1 year, Wage is predicted to increase by 0.45/hour, holding Age and Experience constant. a-2. Interpret the point estimate for 82. As Experience increases by 1 year, Wage is predicted to increase by 0.45/hour. o As Experience increases by 1 year, Wage is predicted to increase by 1.44/hour. As Experience increases by 1 year, Wage is predicted to increase by 1.44/hour, holding Age and Education constant. o As Experience increases by 1 year, Wage is predicted to increase by 0.45/hour, holding Age and Education constant. b. What is the sample regression equation? (Negative values should be indicated by a minus sign. Round your answers to 2 decimal places.) = Education + Experience + Age C. Predict the hourly wage rate for a 30-year-old worker with 4 years of higher education and 3 years of experience. (Round your answer to 2 decimal places.)
Step by Step Solution
There are 3 Steps involved in it

Get step-by-step solutions from verified subject matter experts