

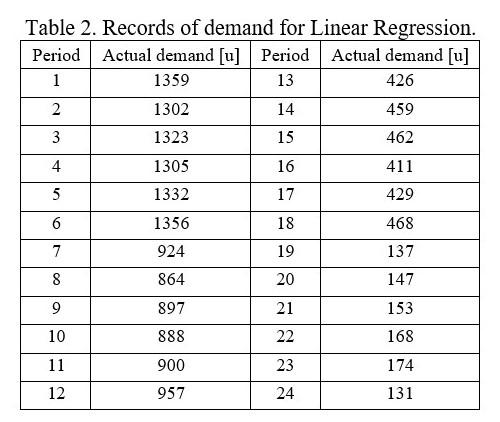
Question: Using data in Table 2, respond to the following. Present a graph to observe the behavior of the dat Is there seasonality? Is there a
- Using data in Table 2, respond to the following.
- Present a graph to observe the behavior of the dat Is there seasonality? Is there a positive or negative trend? Explain based on the graph. (Value: 5% total).
- Report the values of the intercept and the coefficient of the slope for the linear regression. (Value: 5% total).
- Use the parameters obtained in the linear regression to calculate the forecast (Ft) for periods 1 to 24. (Value: 5% total).
- Calculate MAPE, MSE, and MAD for the forecast calculated in part (c). (Value: 5% total).
- Using the results of part (b), calculate forecast (Ft) for periods 25 to 30. (Value: 5% total).
Step by Step Solution
There are 3 Steps involved in it
1 Expert Approved Answer
Step: 1 Unlock

Question Has Been Solved by an Expert!
Get step-by-step solutions from verified subject matter experts
Step: 2 Unlock
Step: 3 Unlock