

Question: Using data on Table below compute the marginal product and average product. Illustrate the TP, AP and MP using graph. And identify the stages of
Using data on Table below compute the marginal product and average product. Illustrate the TP, AP and MP using graph. And identify the stages of law variable proportion and explain why.
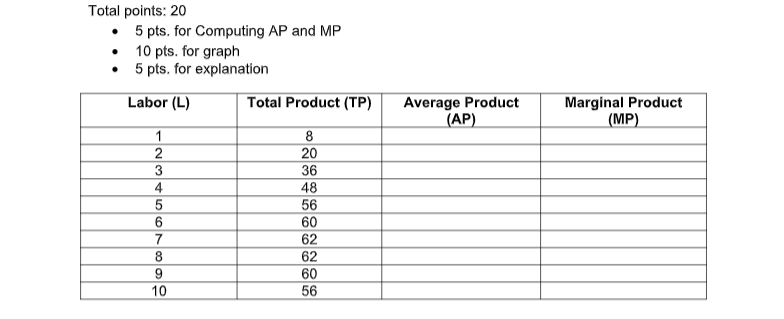
Total points: 20 5 pts. for Computing AP and MP 10 pts. for graph . 5 pts. for explanation Labor (L) Total Product (TP) Average Product Marginal Product (AP) (MP) 8 20 36 48 56 60 62 8 62 60 10 56
Step by Step Solution
There are 3 Steps involved in it
1 Expert Approved Answer
Step: 1 Unlock

Question Has Been Solved by an Expert!
Get step-by-step solutions from verified subject matter experts
Step: 2 Unlock
Step: 3 Unlock