

Question: using dataset from https://data.world/govex/resistance-response-training how can I find these answers using excel ONLY please step by step 1. How many unique police officers are represented


using dataset from https://data.world/govex/resistance-response-training
how can I find these answers using excel ONLY please
step by step
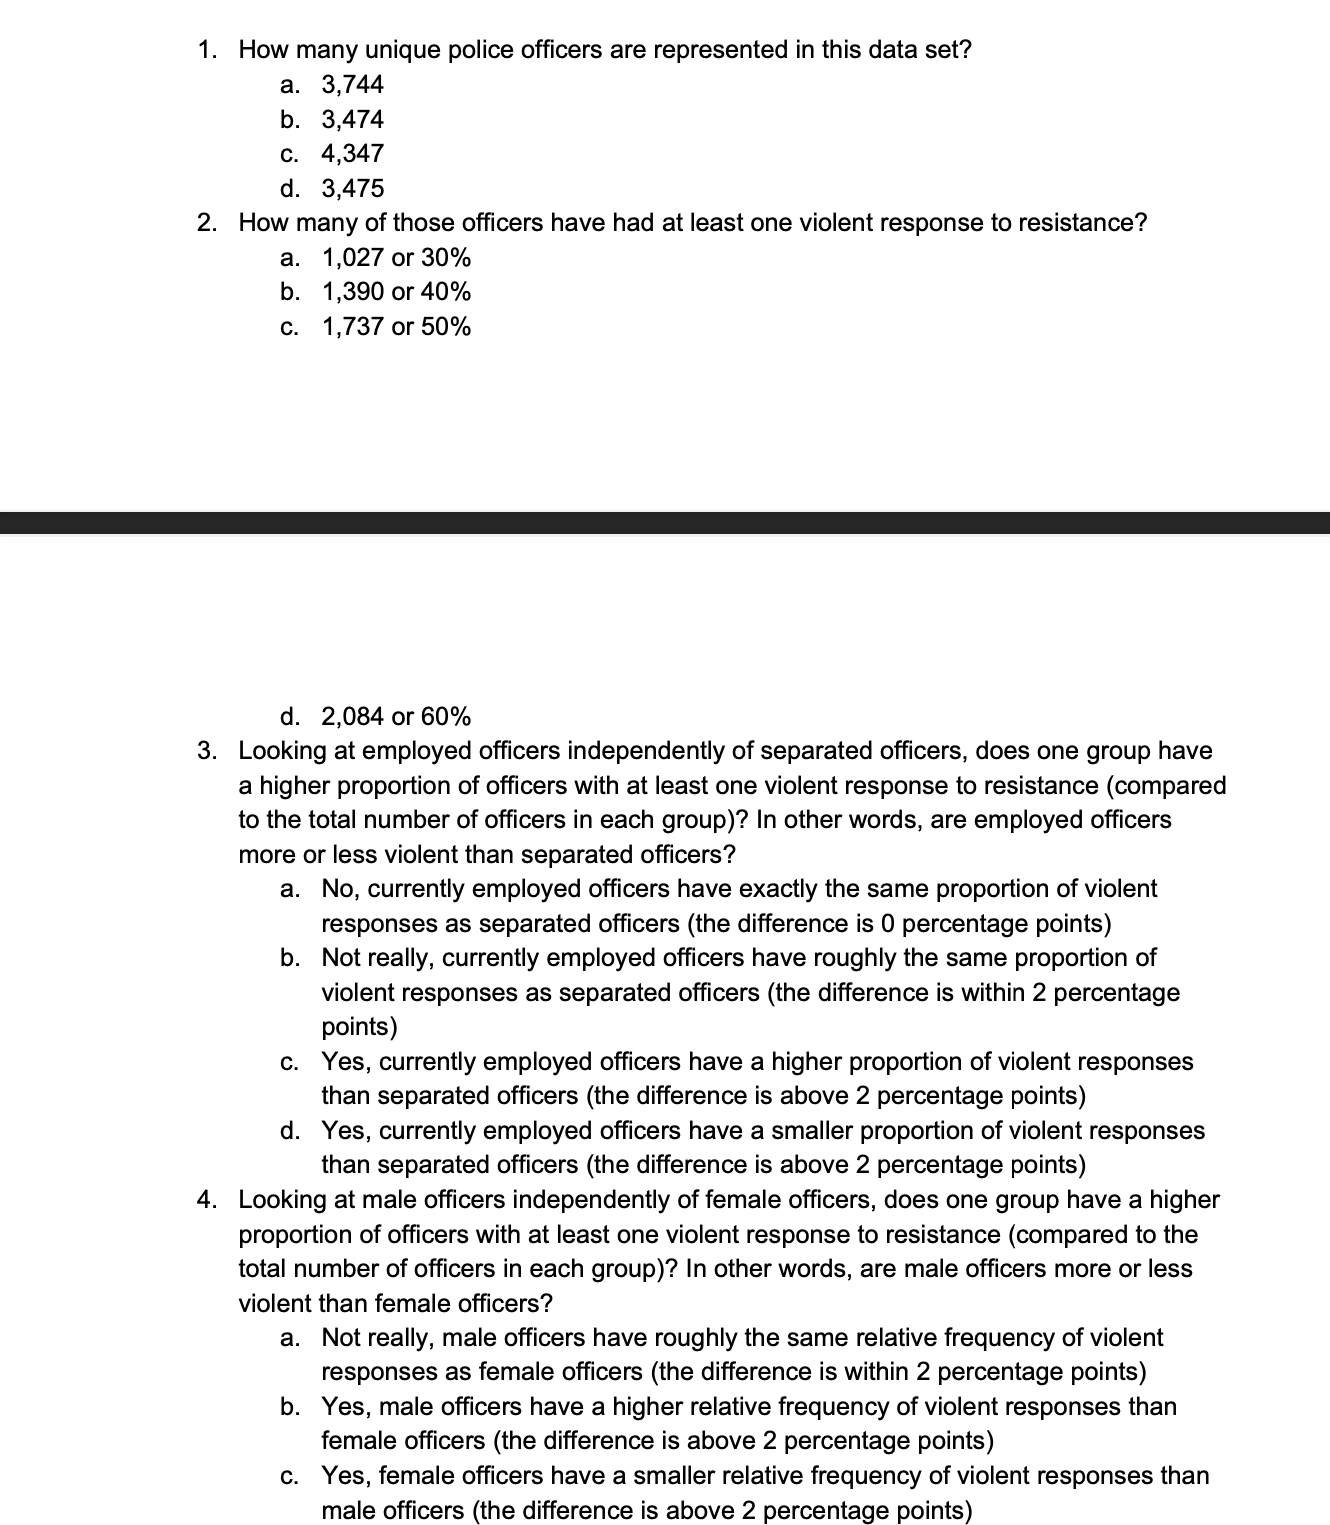

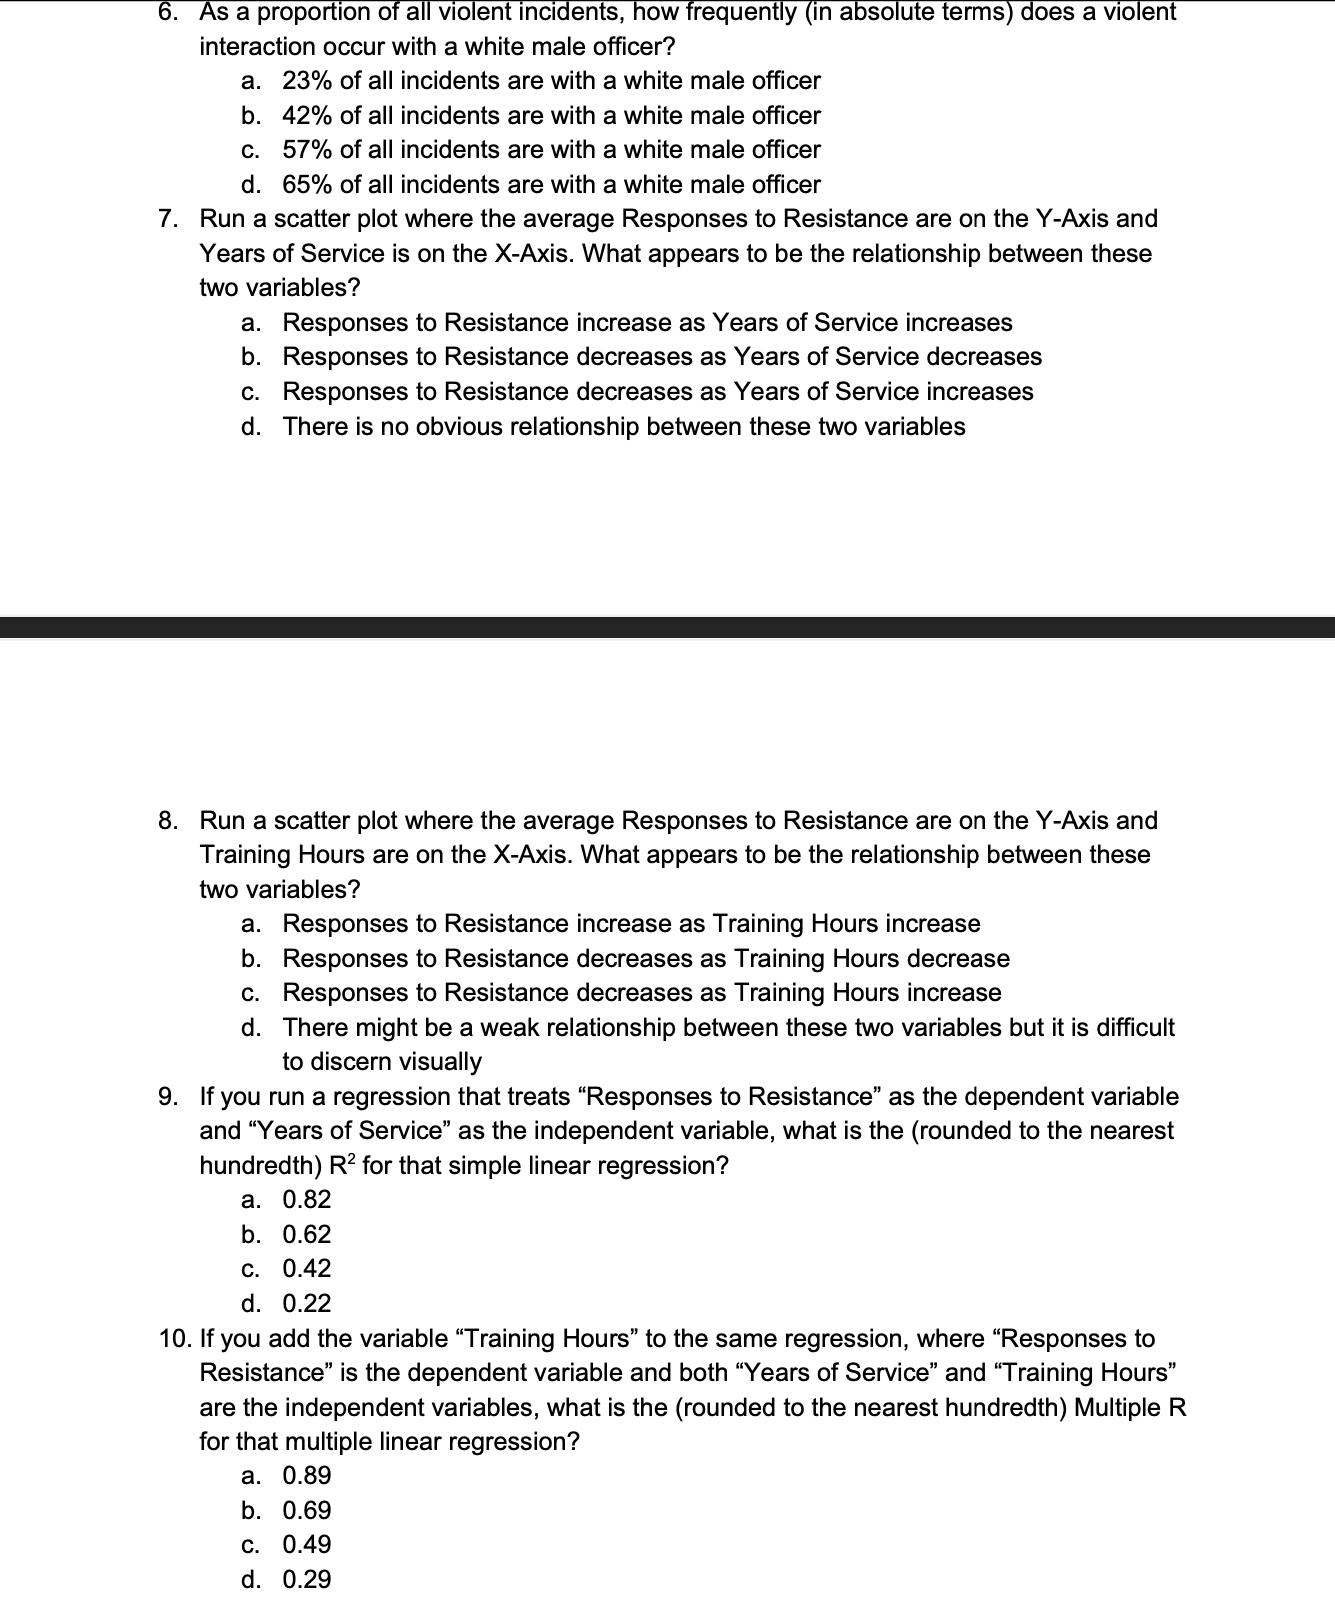
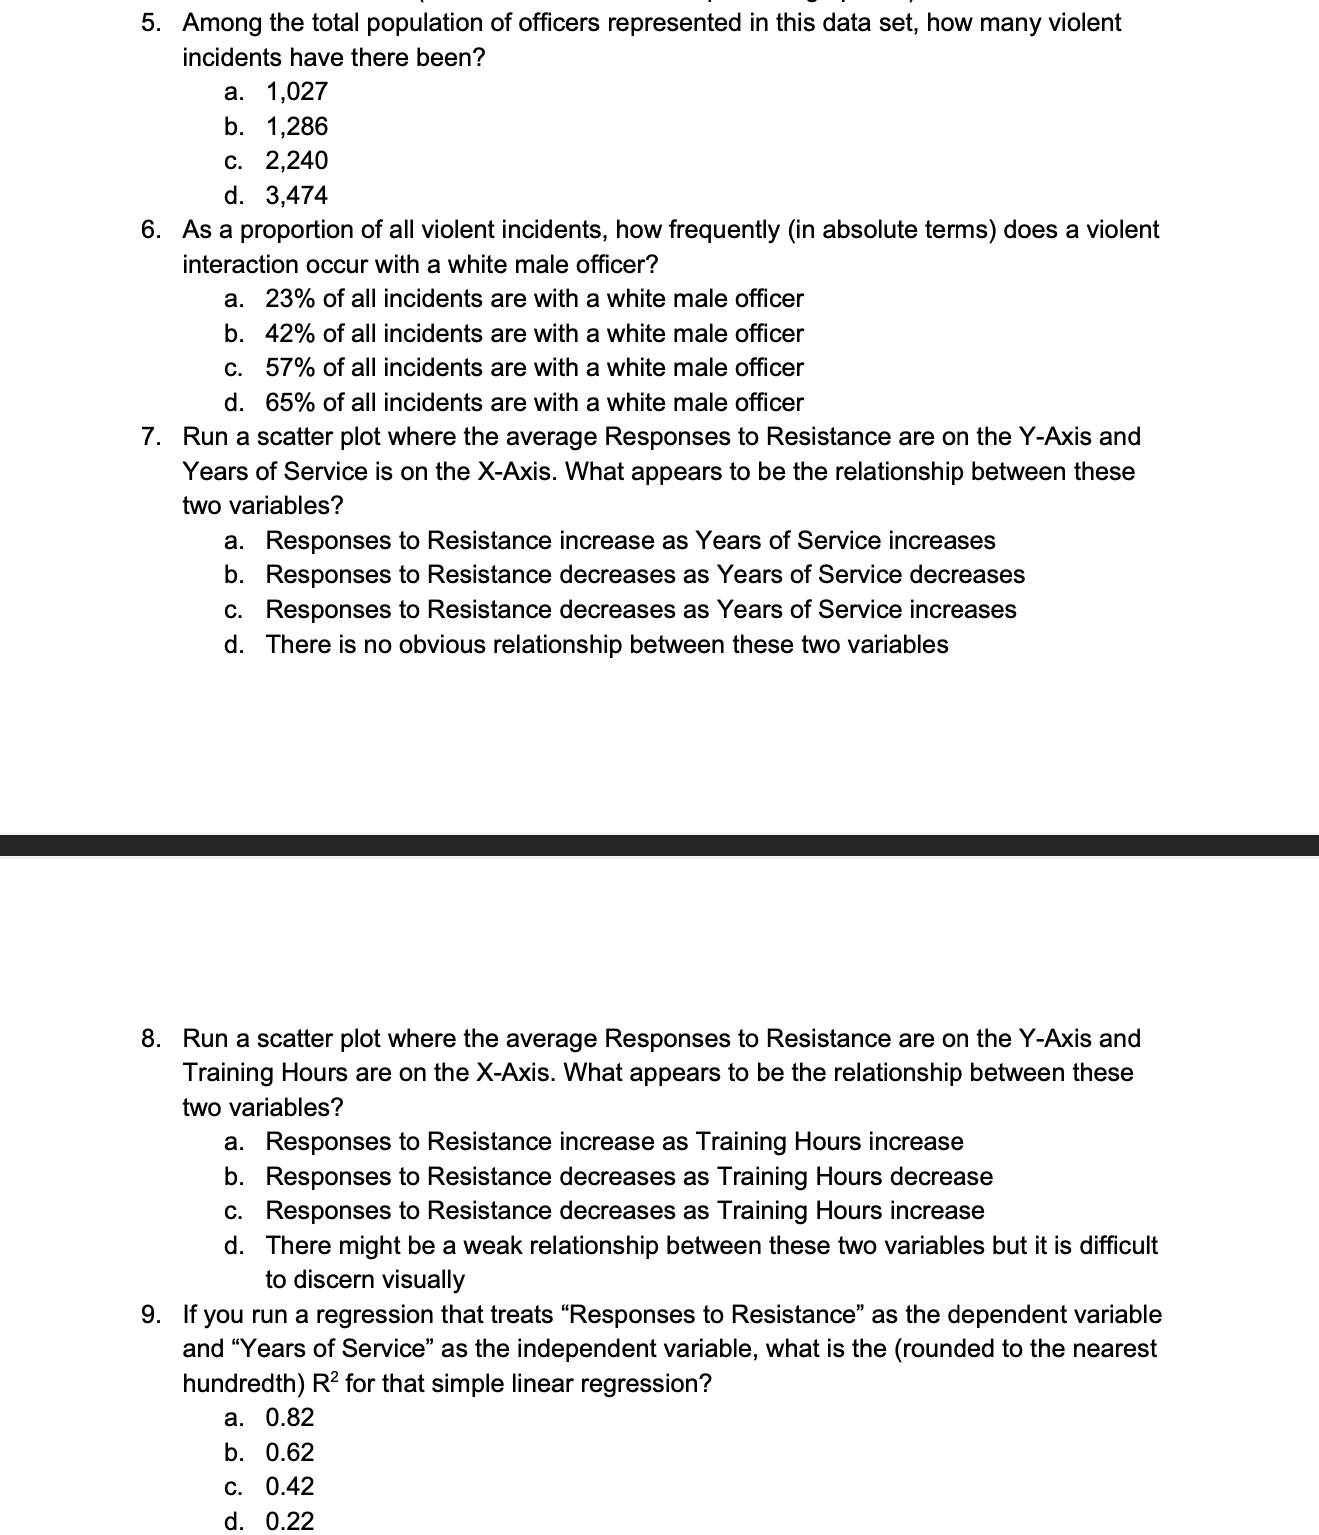
1. How many unique police officers are represented in this data set? a. 3,744 b. 3,474 . 4,347 d. 3,475 2. How many of those officers have had at least one violent response to resistance? a. 1,027 or 30% b. 1,390 or 40% c. 1,737 or 50% d. 2,084 or 60% 3. Looking at employed officers independently of separated officers, does one group have a higher proportion of officers with at least one violent response to resistance (compared to the total number of officers in each group)? In other words, are employed officers more or less violent than separated officers? a. No, currently employed officers have exactly the same proportion of violent responses as separated officers (the difference is 0 percentage points) b. Not really, currently employed officers have roughly the same proportion of violent responses as separated officers (the difference is within 2 percentage points) C . Yes, currently employed officers have a higher proportion of violent responses than separated officers (the difference is above 2 percentage points) d. Yes, currently employed officers have a smaller proportion of violent responses than separated officers (the difference is above 2 percentage points) 4. Looking at male officers independently of female officers, does one group have a higher proportion of officers with at least one violent response to resistance (compared to the total number of officers in each group)? In other words, are male officers more or less violent than female officers? a. Not really, male officers have roughly the same relative frequency of violent responses as female officers (the difference is within 2 percentage points) b. Yes, male officers have a higher relative frequency of violent responses than female officers (the difference is above 2 percentage points) c. Yes, female officers have a smaller relative frequency of violent responses than male officers (the difference is above 2 percentage points)5. Among the total population of ofcers represented in this data set, how many violent incidents have there been? a. 1,027 b. 1,286 0. 2,240 d. 3,474 6. As a proportion of all violent incidents, how frequently (in absolute terms) does a violent interaction occur with a white male ofcer? a. 23% of all incidents are with a white male ofcer b. 42% of all incidents are with a white male ofcer 0. 57% of all incidents are with a white male ofcer d. 65% of all incidents are with a white male ofcer 7. Run a scatter plot where the average Responses to Resistance are on the Y-Axis and Years of Service is on the XAxis. What appears to be the relationship between these two variables? a. Responses to Resistance increase as Years of Service increases b. Responses to Resistance decreases as Years of Service decreases c. Responses to Resistance decreases as Years of Service increases d There is no obvious relationship between these two variables 8. Run a scatter plot where the average Responses to Resistance are on the YAxis and Training Hours are on the X-Axis. What appears to be the relationship between these two variables? a. Responses to Resistance increase as Training Hours increase b. Responses to Resistance decreases as Training Hours decrease c. Responses to Resistance decreases as Training Hours increase d. There might be a weak relationship between these two variables but it is difcult to discern visually 9. If you run a regression that treats \"Responses to Resistance\" as the dependent variable and "Years of Service" as the independent variable, what is the (rounded to the nearest hundredth) R2 for that simple linear regression? a. 0.82 b. 0.62 c. 0.42 d. 0.22 6. As a proportion of all violent incidents, how frequently (in absolute terms) does a violent interaction occur with a white male officer? a. 23% of all incidents are with a white male officer b. 42% of all incidents are with a white male officer c. 57% of all incidents are with a white male officer d. 65% of all incidents are with a white male officer 7. Run a scatter plot where the average Responses to Resistance are on the Y-Axis and Years of Service is on the X-Axis. What appears to be the relationship between these two variables? a. Responses to Resistance increase as Years of Service increases b. Responses to Resistance decreases as Years of Service decreases c. Responses to Resistance decreases as Years of Service increases d. There is no obvious relationship between these two variables 8. Run a scatter plot where the average Responses to Resistance are on the Y-Axis and Training Hours are on the X-Axis. What appears to be the relationship between these two variables? a. Responses to Resistance increase as Training Hours increase b. Responses to Resistance decreases as Training Hours decrease . Responses to Resistance decreases as Training Hours increase d. There might be a weak relationship between these two variables but it is difficult to discern visually 9. If you run a regression that treats "Responses to Resistance" as the dependent variable and "Years of Service" as the independent variable, what is the (rounded to the nearest hundredth) R2 for that simple linear regression? a. 0.82 b. 0.62 c. 0.42 d. 0.22 10. If you add the variable "Training Hours" to the same regression, where "Responses to Resistance" is the dependent variable and both "Years of Service" and "Training Hours" are the independent variables, what is the (rounded to the nearest hundredth) Multiple R for that multiple linear regression? a. 0.89 b. 0.69 C. 0.49 d. 0.29
Step by Step Solution
There are 3 Steps involved in it

Get step-by-step solutions from verified subject matter experts