

Question: Using each of the five multiples individually, estimate the share prices of Pfizer Inc. (5.5pts) Note that: i. for ratios involving EV, you need to
Using each of the five multiples individually, estimate the share prices of Pfizer Inc. (5.5pts) Note that: i. for ratios involving EV, you need to convert to Market Cap by subtracting off the difference between Pfizers EV and Market Cap (i.e., the difference between EV and Market Cap is equal to Debt minus Cash); ii. for the P/B multiple, you can use directly the Book Value per Share without calculating EV or Market Cap
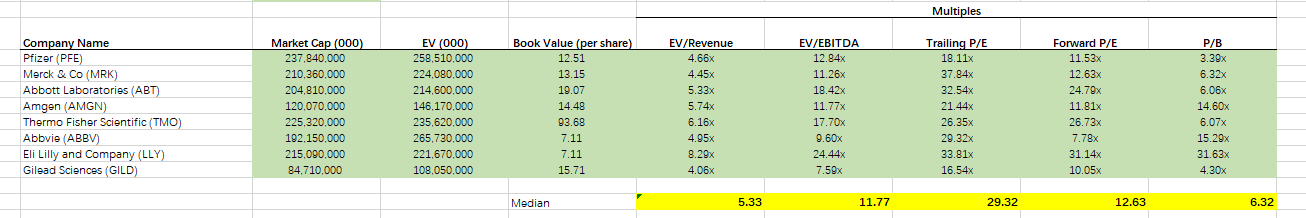
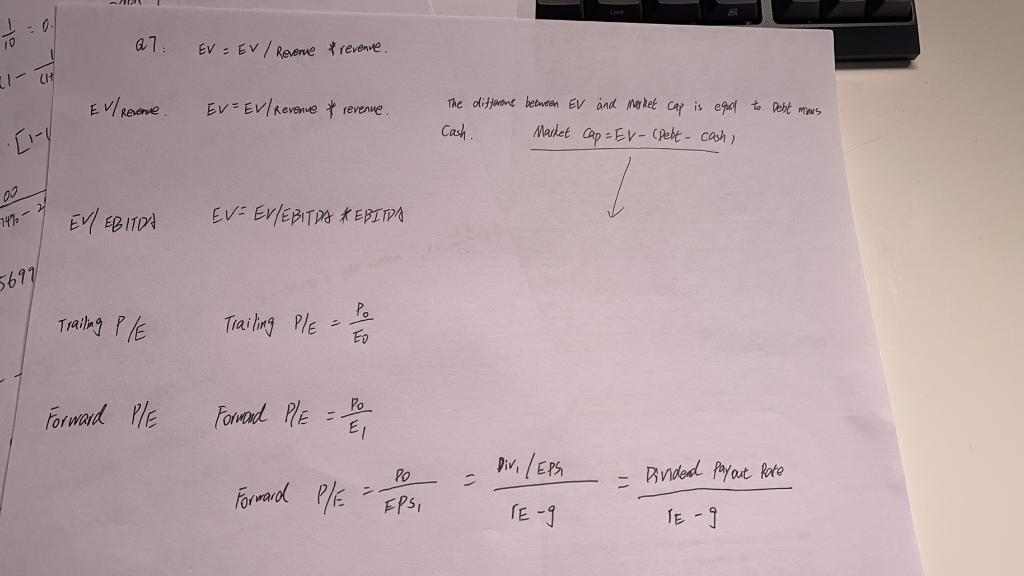
Multiples % Company Name Pfizer (PFE Merck & Co (MRK) Abbott Laboratories (ABT) Amgen (AMGN) Thermo Fisher Scientific (TMO) Abbvie ABBV) Eli Lilly and Company (LLY) Gilead Sciences (GILD) Market Cap (000) 237.840.000 210.360,000 204.810.000 120.070,000 225.320,000 192.150.000 215.090.000 84.710.000 EV (000) 258,510.000 224.080.000 214,600,000 146.170.000 235.620,000 2958 265.730.000 221.670,000 108,050,000 Book Value (per share) 12.51 13.15 19.07 14.48 93.68 02.0 7.11 7.11 15.71 EV/Revenue 4.66x 4.45x 5.33x 5.74x % 6.16x 4.95% % 8.29x 4.06x EV/EBITDA 12.84x 11.26x 18.42x 11.77x 17.70% 9.60x % 24.44x 7.59x Trailing P/E 18.11% 37.84x 32.54x 21 21.44x 26.35x 29.32% 33.81x 16.54x Forward P/E 11.53x 12.63x 24.79% % 11 01 11.81% 26.73x P/B 3.39% 6.32x 6.06x 14. 14.60x 6.07x 15.29x 31.63% 4.30X 7.78X 31.14x 10.05x Median 5.33 11.77 29.32 12.63 6.32 : 0 10 27. EV - EV / Revenue revenue Ev/ Revenue. EV - EV / Revenue revenue The different between EV and market cap is equal to Debt manus Cash Market Cap - EV - Debt - cash [1-4 0 74% - 2 EV/ EBITDA EV- EV/EBITDS & EBITDA 5699 Trailing P/E Trailing Ple Po ED Po Forward P/E Forward Ple = El Dir, /EPSI Po Dividend payout Rate Forward P/E EPS, E-9 E-9 Multiples % Company Name Pfizer (PFE Merck & Co (MRK) Abbott Laboratories (ABT) Amgen (AMGN) Thermo Fisher Scientific (TMO) Abbvie ABBV) Eli Lilly and Company (LLY) Gilead Sciences (GILD) Market Cap (000) 237.840.000 210.360,000 204.810.000 120.070,000 225.320,000 192.150.000 215.090.000 84.710.000 EV (000) 258,510.000 224.080.000 214,600,000 146.170.000 235.620,000 2958 265.730.000 221.670,000 108,050,000 Book Value (per share) 12.51 13.15 19.07 14.48 93.68 02.0 7.11 7.11 15.71 EV/Revenue 4.66x 4.45x 5.33x 5.74x % 6.16x 4.95% % 8.29x 4.06x EV/EBITDA 12.84x 11.26x 18.42x 11.77x 17.70% 9.60x % 24.44x 7.59x Trailing P/E 18.11% 37.84x 32.54x 21 21.44x 26.35x 29.32% 33.81x 16.54x Forward P/E 11.53x 12.63x 24.79% % 11 01 11.81% 26.73x P/B 3.39% 6.32x 6.06x 14. 14.60x 6.07x 15.29x 31.63% 4.30X 7.78X 31.14x 10.05x Median 5.33 11.77 29.32 12.63 6.32 : 0 10 27. EV - EV / Revenue revenue Ev/ Revenue. EV - EV / Revenue revenue The different between EV and market cap is equal to Debt manus Cash Market Cap - EV - Debt - cash [1-4 0 74% - 2 EV/ EBITDA EV- EV/EBITDS & EBITDA 5699 Trailing P/E Trailing Ple Po ED Po Forward P/E Forward Ple = El Dir, /EPSI Po Dividend payout Rate Forward P/E EPS, E-9 E-9
Step by Step Solution
There are 3 Steps involved in it

Get step-by-step solutions from verified subject matter experts