

Question: Using Excel and showing formulas used, Develop complete forecasts of Starbucks' income statements, balance sheets, and statements of cash flows of Year +1 through +5.
Using Excel and showing formulas used, Develop complete forecasts of Starbucks' income statements, balance sheets, and statements of cash flows of Year +1 through +5. As illustrated in this chapter, develop objectives and unbiased forecast assumptions for all of Starbucks' future operating, investing, and financing activities through Year +5 and capture those expectations using financial statement forecasts.
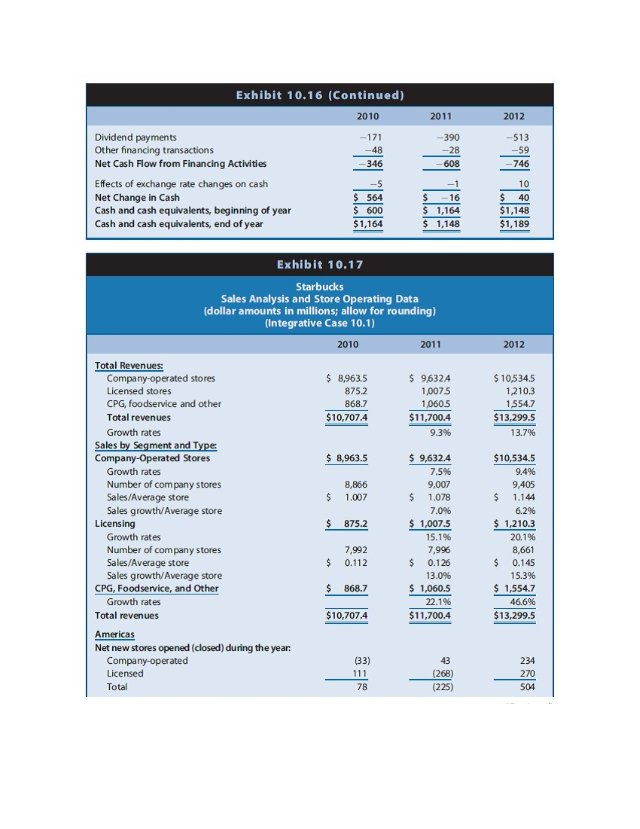
Starbucks' business also involves generating revenues from licensing Starbucks stores and selling Starbucks coffee and other products through food service accounts, grocery stores, warehouse clubs, and so on. Us the data in Exhibits 10.17 to build forecasts of future revenues from licensing activities and foodservice and other activities.
NOTE: Management guidance, disclosed in 2012 and again at the end of the first quarter in Year +1, indicates Starbucks is planning to open roughly 1,300 new stores during Year +1 (300 owned and 300 licensed stores in the Americas; 200 owned and 400 licensed stores in the China Asia Pacific segment; 34 owned and 66 licensed stores in Europe, the Middle East and Africa segment. Starbucks management also indicates they expect to incur 1,200 million in capital expenditures during Year +1. Management did not provide guidance beyond Year +1.
Exhibit 10.16 (Continued) 2012 2010 Dividend payments Other financing transactions Net Cash low from Financing Activities 746 Effects of exchange rate changes on cash Net Change in Cash 564 600 1,164 $ 1,164 $1,148 Cash and cash equivalents, beginning of year Cash and cash equivalents, end of year $1,189 $1,148 Exhibit 10.17 Starbucks Sales Analysis and Store Operating Data dollar amounts in millions; allow for rounding) (Integrative Case 10.1) 2011 2012 2010 Total Revenues Company-operated stores Licensed stores $10,5345 12103 8,9635 96324 1,0075 1,0605 5 CPG, foodservice and other $10,7074 $11,700.4 $13,299.5 Total revenues Growth rates 9.3% 13.7% ment and $10,534.5 ted Stores 8,963.5 $9,632.4 Growth rates 7.5% 9.4% Number of company stores Sales/Average store Sales growth/Average store Licensing 9,007 1.007 $ 1.078 $ 1.144 70% $ 875.2 1.007.5 15.1% 1,210.3 Growth rates 20.1 % 8,661 Number of company stores Sales/Average store 7,992 7,996 $0.112 $ 0.126 $ 0.145 Sales growth/Average store CPG, Foodservice, and Other 13.0% 15.3% $868.7 $1,060.5 $ 1,554.7 Growth rates 22.1% $10,7074 $11,700.4 $13,299.5 Total revenues Net new stores opened (closed) during the year Company-operated (225) Total Exhibit 10.16 (Continued) 2012 2010 Dividend payments Other financing transactions Net Cash low from Financing Activities 746 Effects of exchange rate changes on cash Net Change in Cash 564 600 1,164 $ 1,164 $1,148 Cash and cash equivalents, beginning of year Cash and cash equivalents, end of year $1,189 $1,148 Exhibit 10.17 Starbucks Sales Analysis and Store Operating Data dollar amounts in millions; allow for rounding) (Integrative Case 10.1) 2011 2012 2010 Total Revenues Company-operated stores Licensed stores $10,5345 12103 8,9635 96324 1,0075 1,0605 5 CPG, foodservice and other $10,7074 $11,700.4 $13,299.5 Total revenues Growth rates 9.3% 13.7% ment and $10,534.5 ted Stores 8,963.5 $9,632.4 Growth rates 7.5% 9.4% Number of company stores Sales/Average store Sales growth/Average store Licensing 9,007 1.007 $ 1.078 $ 1.144 70% $ 875.2 1.007.5 15.1% 1,210.3 Growth rates 20.1 % 8,661 Number of company stores Sales/Average store 7,992 7,996 $0.112 $ 0.126 $ 0.145 Sales growth/Average store CPG, Foodservice, and Other 13.0% 15.3% $868.7 $1,060.5 $ 1,554.7 Growth rates 22.1% $10,7074 $11,700.4 $13,299.5 Total revenues Net new stores opened (closed) during the year Company-operated (225) Total
Step by Step Solution
There are 3 Steps involved in it

Get step-by-step solutions from verified subject matter experts