

Question: Develop complete forecasts of Starbucks income statements, balance sheets, and statements of cash flows for Years +1 through +5. As illustrated in this chapter, develop
Develop complete forecasts of Starbucks’ income statements, balance sheets, and statements of cash flows for Years +1 through +5. As illustrated in this chapter, develop objective and unbiased forecast assumptions for all of Starbucks’ future operating, investing, and financing activities through Year +5 and capture those expectations using financial statement forecasts.
a. Build your own spreadsheets to develop and capture your financial statement forecast assumptions and data for Starbucks. Building your own financial statement forecast spreadsheets is a valuable learning experience. You can use the PepsiCo examples presented throughout this chapter as models to follow in building your spreadsheets. If you have already had the learning experience of building forecast spreadsheets, you can build your financial statement forecasts using the FSAP template for Starbucks that accompanies this book. If you want to start from scratch, you can download the blank FSAP template from the book’s website: www.cengagebrain.com and input the accounting data for Starbucks from Exhibits 10.14–10.16 into the Data Spreadsheet.
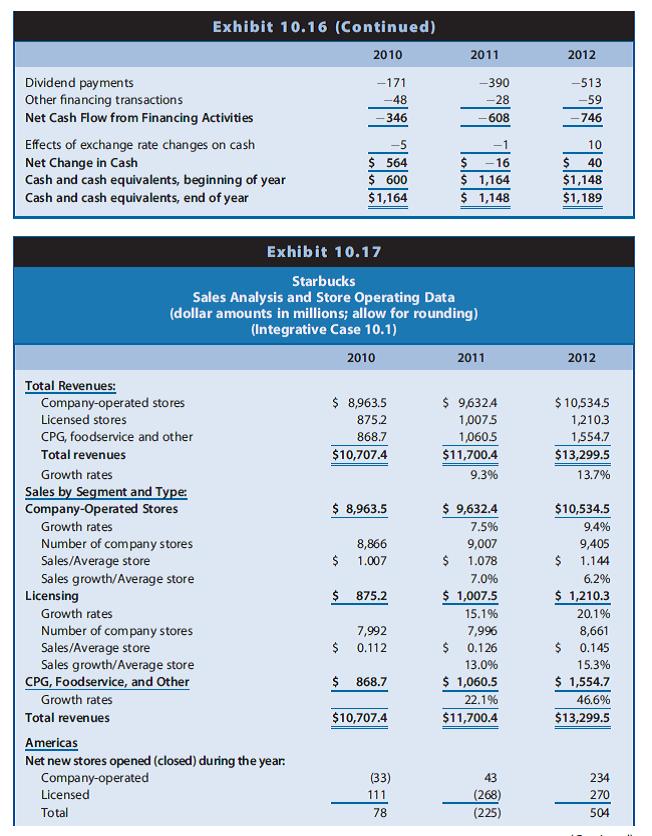
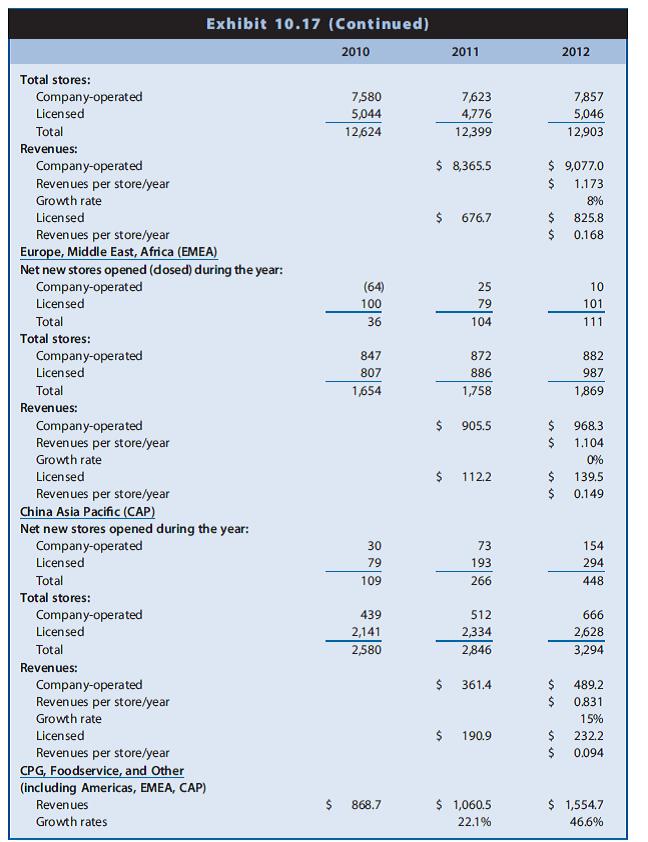
b. Starbucks’ operating, investing, and financing activities involve primarily opening and operating company-owned retail coffee shops in the United States and around the world. Starbucks’ annual reports provide useful data on the number of company-operated stores Starbucks owns, the new stores it opens each year, and the same-store sales growth rates. These data reveal that Starbucks’ revenues and revenue growth rates differ significantly across different segments. Use these data, summarized in Exhibit 10.17 as a basis to forecast (1) Starbucks’ future sales from existing stores, (2) the number of new company-operated stores Starbucks will open, (3) future sales from new stores, and (4) capital expenditures for new stores.
c. Starbucks’ business also involves generating revenues from licensing Starbucks stores and selling Starbucks coffee and other products through foodservice accounts, grocery stores, warehouse clubs, and so on. Use the data in Exhibits 10.17 to build forecasts of future revenues from licensing activities food service and other activities.
d. Use your forecasts of capital expenditures for new stores together with Starbucks’ data on property, plant, and equipment and depreciation to build a schedule to forecast property, plant, and equipment and depreciation expenses as described in the chapter for PepsiCo.
e. Starbucks appears to use repurchases of common equity shares as the flexible financial account for balancing the balance sheet. Common equity share repurchases are similar to dividends as a mechanism to distribute excess capital to common equity shareholders. Therefore, build your financial statement forecasts using dividends as the flexible financial account.
f. Save your forecast spreadsheets. In subsequent chapters, you will continue to use Starbucks as a comprehensive integrative case. In those chapters, you will apply the valuation models to your forecasts of Starbucks’ future earnings, cash flows, and dividends to assess Starbucks’ share value.
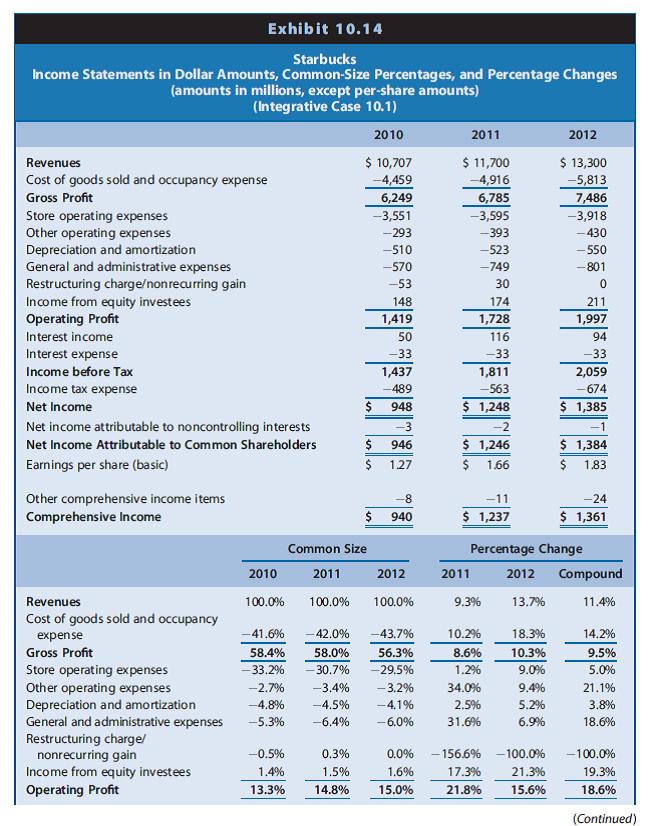
Starbucks Income Statements in Dollar Amounts, Common-Size Percentages, and Percentage Changes (amounts in millions, except per-share amounts) (Integrative Case 10.1) 2010 $ 10,707 -4,459 6,249 -3,551 -293 -510 -570 -53 148 1,419 50 -33 1,437 -489 948 Revenues Cost of goods sold and occupancy expense Gross Profit Store operating expenses Other operating expenses Depreciation and amortization General and administrative expenses Restructuring charge/non recurring gain Income from equity investees Operating Profit Interest income Interest expense Income before Tax Income tax expense Net Income Exhibit 10.14 Net income attributable to noncontrolling interests Net Income Attributable to Common Shareholders Earnings per share (basic) Other comprehensive income items Comprehensive Income Revenues Cost of goods sold and occupancy expense Gross Profit Store operating expenses Other operating expenses Depreciation and amortization General and administrative expenses Restructuring charge/ nonrecurring gain Income from equity investees Operating Profit 2010 100.0% -41.6% 58.4% -33.2% -2.7% -4.8% -5.3% -0.5% 1.4% 13.3% $ $ 0.3% 1.5% 14.8% $ $ -3 946 1.27 -8 940 Common Size 2011 2012 100.0% 100.0% 42.0% -43.7% 58.0% 56.3% -30.7% -29.5% -3.4% -3.2% -4.5% -4.1% -6.4% -6.0% 0.0% 1.6% 15.0% 2011 $ 11,700 -4,916 6,785 -3,595 -393 -523 -749 30 174 1,728 116 -33 1,811 -563 $ 1,248 -2 $ 1,246 $ 1.66 2011 9.3% 10.2% 8.6% 1.2% 34.0% 2.5% 31.6% $ 1,237 Percentage Change 13.7% 2012 $ 13,300 -5,813 7,486 -3,918 -430 -550 -801 18.3% 10.3% 9.0% 9.4% 5.2% 6.9% 0 211 1,997 -156.6% -100.0% 17.3% 21.3% 21.8% 15.6% 94 -33 2,059 -674 $ 1,385 -1 $ 1,384 $ 1.83 2012 Compound -24 $ 1,361 11.4% 14.2% 9.5% 5.0% 21.1% 3.8% 18.6% -100.0% 19.3% 18.6% (Continued)
Step by Step Solution
3.45 Rating (148 Votes )
There are 3 Steps involved in it
Starbucks Forecasting Framework Years 1 to 5 Based on the data from Exhibits 10141017 and accompanying assumptions below is a detailed outline and approach to forecast Starbucks Income Statement Balan... View full answer

Get step-by-step solutions from verified subject matter experts