

Question: Using Excel, draw the payoff picture for a short position in the put option given in Problem 4 (Problem 4 is the attached image). Stock
Using Excel, draw the payoff picture for a short position in the put option given in Problem 4 (Problem 4 is the attached image).
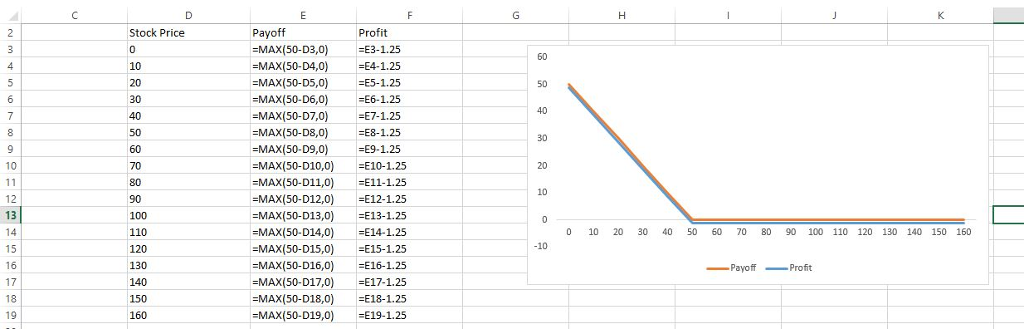
Stock Price Payoff Profit MAX(50-D3,0) E3-1.25 -MAX(50-D4,0 E4-1.25 60 10 MAX(50-D5,0) E5-1 30 =MAX(50-D6,0) -E6-1.25 -MAX(50-D7,0) E7-1.25 MAX(50-D8,0)E8-1.25 -MAX(50-D9,0) -E9-1.25 MAX(50-D10,0)E10-1.25 =MAX(50-D11,0) -E11-1.25 -MAX(50-D12,0 -E12-1.25 MAX(50-D13,0) E13-1.25 -MAX(50-D14,0 E14-1.25 -MAX(50-D15,0)E15-1.25 MAX(50-D16,0)E16-1.2 -MAX(50-D17,0) E17-1.25 MAX(50-D18,0E18-1.25 -MAX(50-D19,0) E19-1.25 40 60 10 70 10 12 13 90 100 110 0 10 20 30 40 50 60 70 80 90 100 110 120 130 140 150 160 15 16 17 18 19 130 140 Payoff -Profit 160 Stock Price Payoff Profit MAX(50-D3,0) E3-1.25 -MAX(50-D4,0 E4-1.25 60 10 MAX(50-D5,0) E5-1 30 =MAX(50-D6,0) -E6-1.25 -MAX(50-D7,0) E7-1.25 MAX(50-D8,0)E8-1.25 -MAX(50-D9,0) -E9-1.25 MAX(50-D10,0)E10-1.25 =MAX(50-D11,0) -E11-1.25 -MAX(50-D12,0 -E12-1.25 MAX(50-D13,0) E13-1.25 -MAX(50-D14,0 E14-1.25 -MAX(50-D15,0)E15-1.25 MAX(50-D16,0)E16-1.2 -MAX(50-D17,0) E17-1.25 MAX(50-D18,0E18-1.25 -MAX(50-D19,0) E19-1.25 40 60 10 70 10 12 13 90 100 110 0 10 20 30 40 50 60 70 80 90 100 110 120 130 140 150 160 15 16 17 18 19 130 140 Payoff -Profit 160
Step by Step Solution
There are 3 Steps involved in it

Get step-by-step solutions from verified subject matter experts