

Question: Using Excel, plot the yield locus using Hills anisotropic yield function for R=0.8, 1.0, 1.5, 2.0, 4, and 6. Use eqn (3-31) for plane
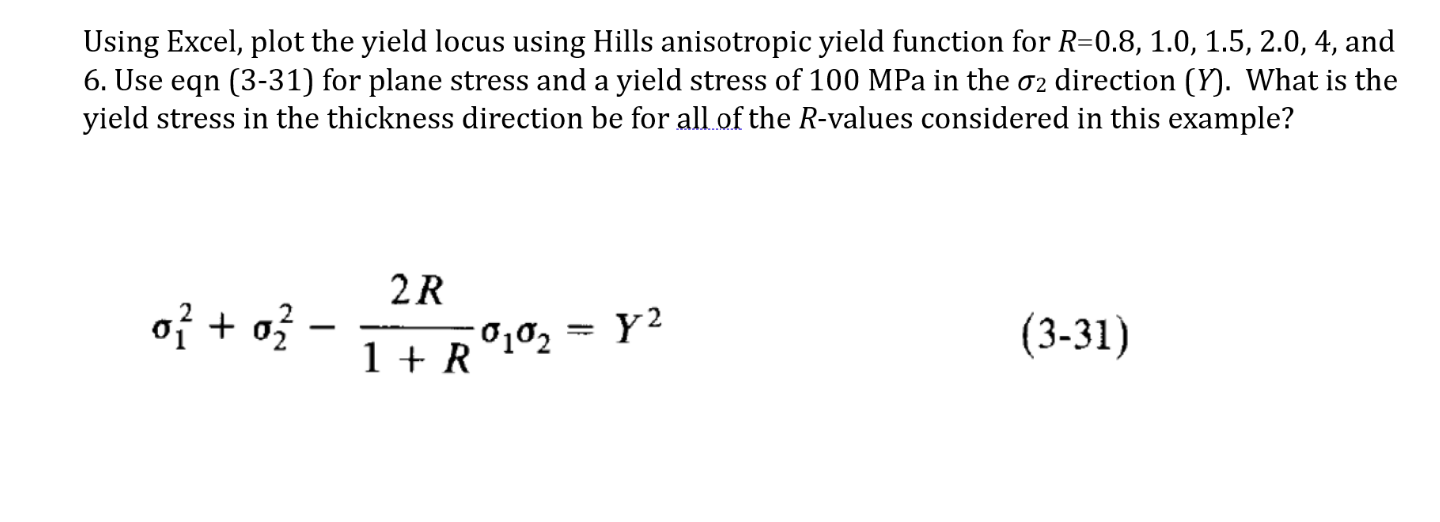
Using Excel, plot the yield locus using Hills anisotropic yield function for R=0.8, 1.0, 1.5, 2.0, 4, and 6. Use eqn (3-31) for plane stress and a yield stress of 100 MPa in the 2 direction (Y). What is the yield stress in the thickness direction be for all of the R-values considered in this example? 2R 0 + 022 - 0102 - Y2 1 + R (3-31)
Step by Step Solution
There are 3 Steps involved in it
1 Expert Approved Answer
Step: 1 Unlock

Question Has Been Solved by an Expert!
Get step-by-step solutions from verified subject matter experts
Step: 2 Unlock
Step: 3 Unlock