

Question: using Excel Questions 1. Given below are the demand schedule and supply schedule for the labour market for supervisors. Remember that demand for labour represents
using Excel
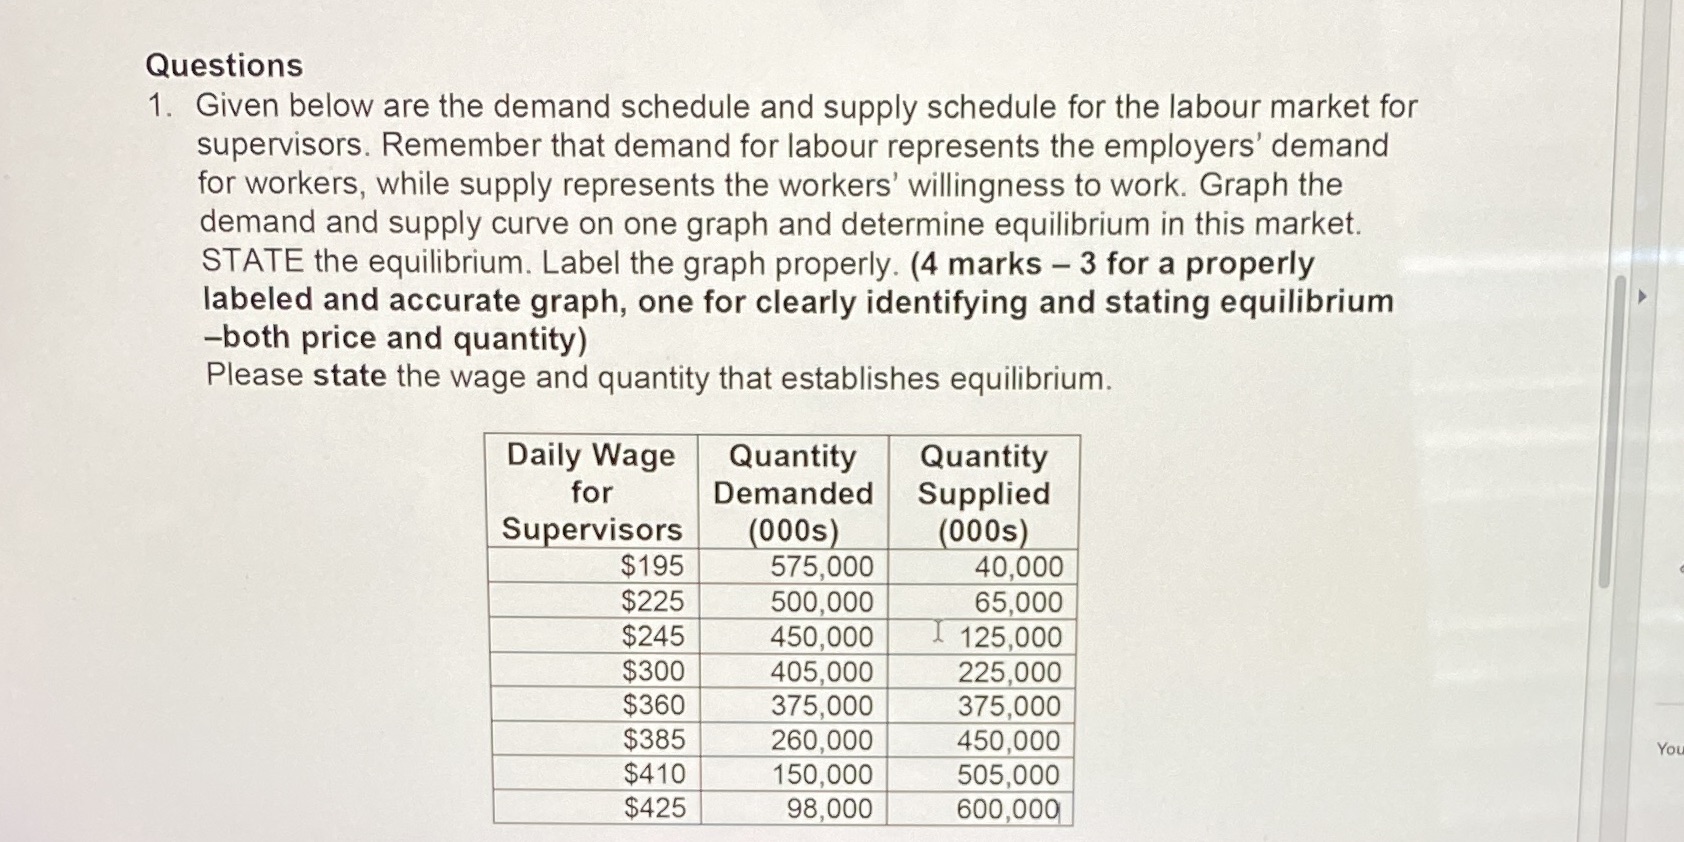
Questions 1. Given below are the demand schedule and supply schedule for the labour market for supervisors. Remember that demand for labour represents the employers' demand for workers, while supply represents the workers' willingness to work. Graph the demand and supply curve on one graph and determine equilibrium in this market. STATE the equilibrium. Label the graph properly. (4 marks - 3 for a properly labeled and accurate graph, one for clearly identifying and stating equilibrium -both price and quantity) Please state the wage and quantity that establishes equilibrium. Daily Wage Quantity Quantity for Demanded Supplied Supervisors (000s) 000s) $195 575,000 40,000 $225 500,000 65,000 $245 450,000 125,000 $300 405,000 225,000 $360 375,000 375,000 $385 260,000 450,000 You $410 150,000 505,000 $425 98,000 600,000
Step by Step Solution
There are 3 Steps involved in it

Get step-by-step solutions from verified subject matter experts