

Question: Using Excel, show the correct functions to solve T test equation. Week # Weekly Weekly Sales($) Sales($) - Rep A - Rep B 4700 5900
Using Excel, show the correct functions to solve T test equation.
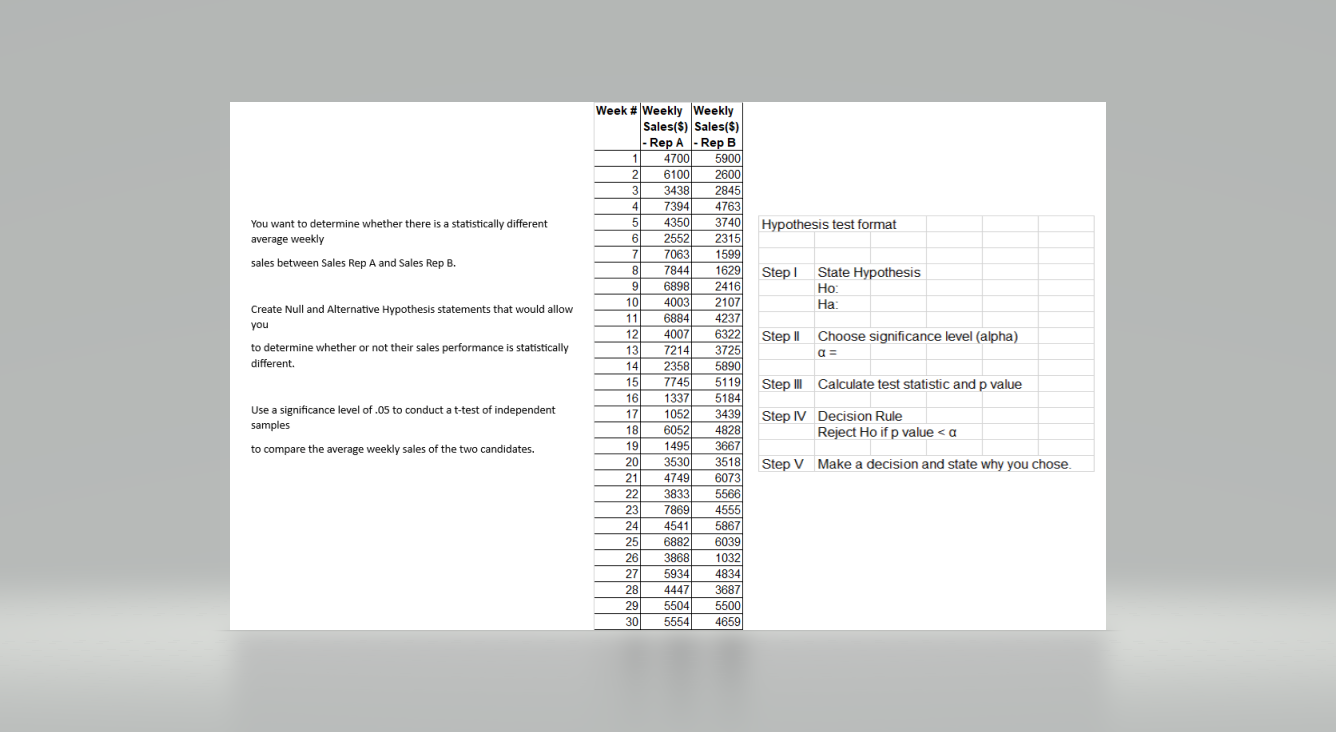
Week # Weekly Weekly Sales($) Sales($) - Rep A - Rep B 4700 5900 6100 2600 3438 2845 7394 4763 You want to determine whether there is a statistically different 4350 3740 Hypothesis test format average weekly 2552 2315 sales between Sales Rep A and Sales Rep B. 7063 1599 7844 1629 Step | State Hypothesis 6898 2416 Ho Create Null and Alternative Hypothesis statements that would allow 4003 2107 Ha you 6884 4237 12 4007 6322 to determine whether or not their sales performance is statistically Step II Choose significance level (alpha) 13 7214 3725 a= different. 14 2358 5890 15 7745 5119 16 Step III Calculate test statistic and p value 1337 5184 Use a significance level of .05 to conduct a t-test of independent 1052 3439 samples 17 Step IV Decision Rule 18 6052 4828 Reject Ho if p value
Step by Step Solution
There are 3 Steps involved in it

Get step-by-step solutions from verified subject matter experts