

Question: using excel Task 1 Using the following the data below, graph the result and use linear regression to obtain the equation of a line. 0
using excel 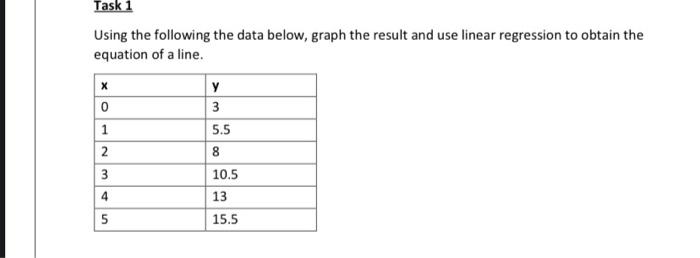
Task 1 Using the following the data below, graph the result and use linear regression to obtain the equation of a line. 0 1 2 3 y 3 5.5 8 10.5 13 15.5 om 4 5
Step by Step Solution
There are 3 Steps involved in it
1 Expert Approved Answer
Step: 1 Unlock

Question Has Been Solved by an Expert!
Get step-by-step solutions from verified subject matter experts
Step: 2 Unlock
Step: 3 Unlock