

Question: Using Excel to construct a table like Table 7-1(The photo attached) to estimate b 1 and b 0 (coefficients of regression line).(a) Write the estimated
Using Excel to construct a table like Table 7-1(The photo attached) to estimate b1 and b0 (coefficients of regression line).(a)
Write the estimated regression line (i.e. sales as a function of adverting expenditures).
Compute R2.(c)
Use Excel regression tool (in Data Analysis) and estimate the regression line. Check whether or not your results in (a) and (c) are consistent with those of Excel output.
In 6 lines, in writing. interpret your results as relationship between advertising expenditures and sales in a Word file.
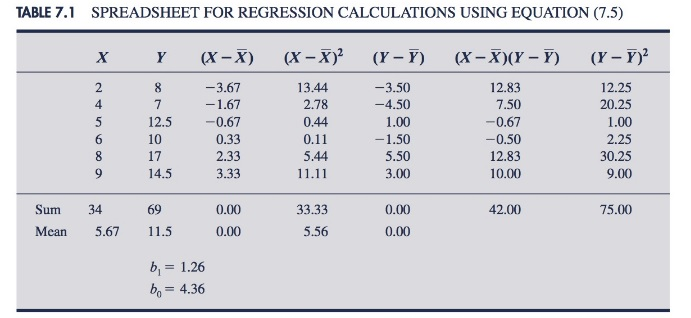
TABLE 7.1 SPREADSHEET FOR REGRESSION CALCULATIONS USING EQUATION (7.5) Y(X-X) (X-X) (Y-Y) (X -X)(Y - Y) (Y-Y)2 -3.67 1.67 -0.67 0.33 2.33 3.33 13.44 2.78 0.44 0.11 5.44 3.50 -4.50 1.00 1.50 5.50 3.00 12.83 7.50 -0.67 -0.50 12.83 10.00 12.25 20.25 1.00 4 12.5 10 17 14.5 30.25 9.00 Sum 34 Mean 5.67 11.5 69 75.00 0.00 0.00 33.33 0.00 42.00 5.56 0.00 bl= 1.26 = 4.36 TABLE 7.1 SPREADSHEET FOR REGRESSION CALCULATIONS USING EQUATION (7.5) Y(X-X) (X-X) (Y-Y) (X -X)(Y - Y) (Y-Y)2 -3.67 1.67 -0.67 0.33 2.33 3.33 13.44 2.78 0.44 0.11 5.44 3.50 -4.50 1.00 1.50 5.50 3.00 12.83 7.50 -0.67 -0.50 12.83 10.00 12.25 20.25 1.00 4 12.5 10 17 14.5 30.25 9.00 Sum 34 Mean 5.67 11.5 69 75.00 0.00 0.00 33.33 0.00 42.00 5.56 0.00 bl= 1.26 = 4.36
Step by Step Solution
There are 3 Steps involved in it

Get step-by-step solutions from verified subject matter experts