

Question: Using flights data from nycflights 1 3 package: 1 . Use the flights data frame to determine the average delay for each destination. Add a
Using "flights" data from nycflights package:
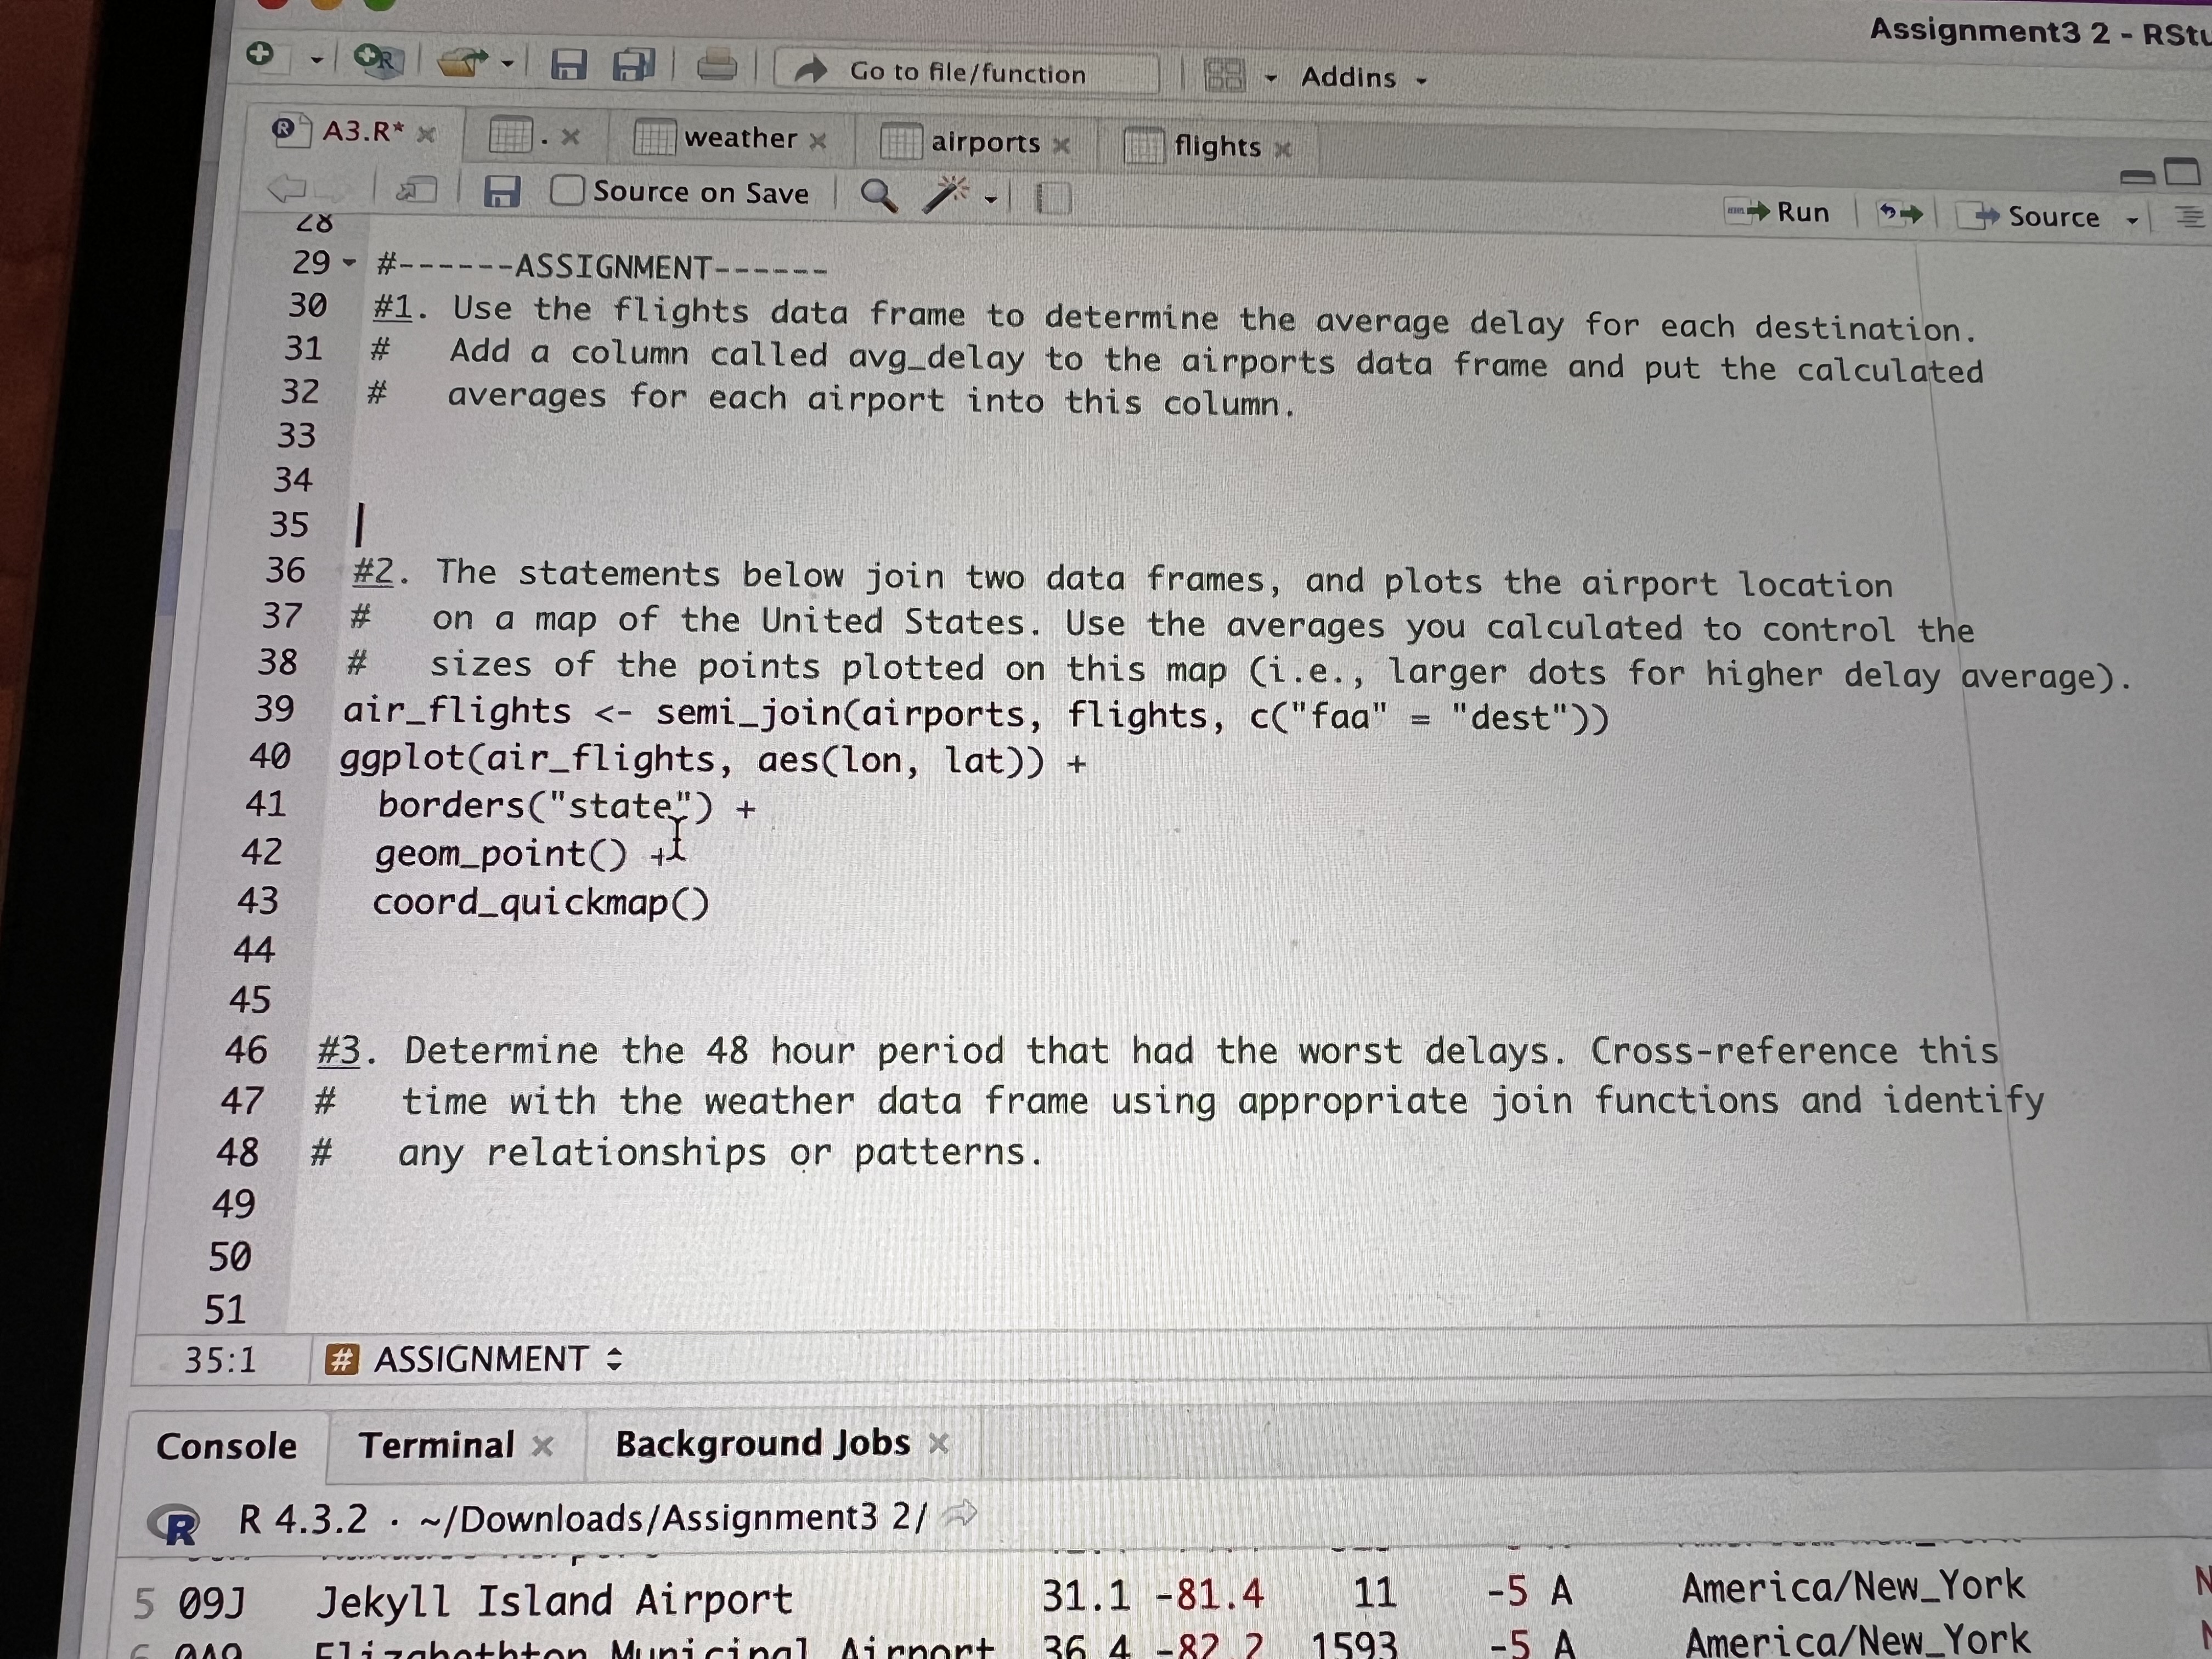
Use the flights data frame to determine the average delay for each destination. Add a column called avgdelay to the airports data frame and put the calculated averages for each airport into this column.
The statements below join two data frames, and plots the airport location on a map of the United States. Use the averages you calculated to control the sizes of the points plotted on this map ie larger dots for higher delay average
airflights semijoinairports flights, cfaa "dest"
ggplotairflights, aeslon lat
bordersstate
geompoint
coordquickmap
# Determine the hour period that had the worst delays. Crossreference this time with the weather data frame using appropriate join functions and identify any relationships or patterns.
Step by Step Solution
There are 3 Steps involved in it
1 Expert Approved Answer
Step: 1 Unlock

Question Has Been Solved by an Expert!
Get step-by-step solutions from verified subject matter experts
Step: 2 Unlock
Step: 3 Unlock