

Question: Using Java, implement the following code and graph the result following the instructions Objectives of this assignment: To compare the running time performance of InsertSort,
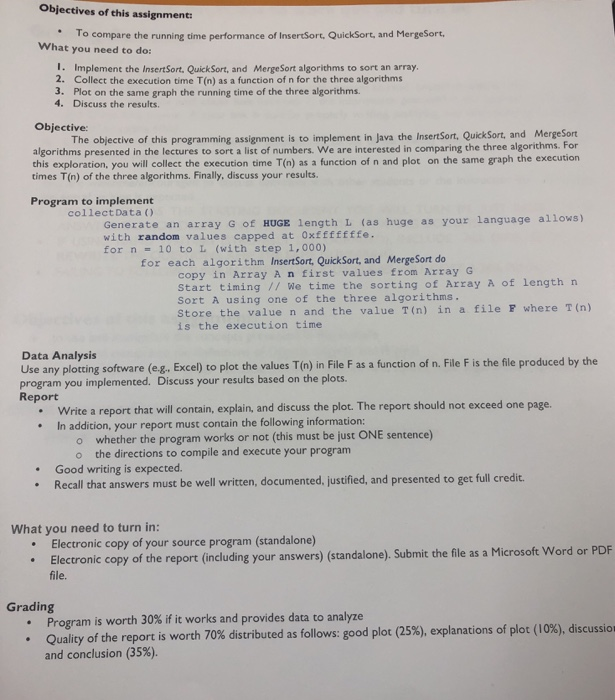
Objectives of this assignment: To compare the running time performance of InsertSort, QuickSort, and MergeSort. What you need to do: I. Implement the InsertSort, QuickSort, and MergeSort algorithms to sort an array. 2. Collect the execution time T(n) as a function of n for the three algorithms 3. Plot on the same graph the running time of the three algorithms. 4. Discuss the results. Objective: The objective of this programming assignment is to implement in Java the InsertSort, QuickSort, and MergeSort algorithms presented in the lectures to sort a list of numbers. We are interested in comparing the three algorithms. For this exploration, you will collect the execution time T(n) as a function of n and plot on the same graph the execution times T(n) of the three algorithms. Finally, discuss your results. Program to implement collectData () Generate an array G of HUGE length L (as huge as your language allows) with random values capped at 0xfffffffe for n = 10 to L (with step 1,000) for each algorithm InsertSort, QuickSort, and Merge Sort do copy in Array A n first values from ArrayG Start timing // We time the sorting of Array A of length n Sort A using one of the three algorithms. store the value n and the value T(n) in a file F where T(n) is the execution time Data Analysis Use any plotting sofeware (eg, Excel) to plot the values T(n) in File F as a function of n. File F is the file produced by the program you implemented. Discuss your results based on the plots. Report Write a report that will contain, explain, and discuss the plot. The report should not exceed one page. In addition, your report must contain the following information: whether the program works or not (chis must be just ONE sentence) the directions to compile and execute your program o .Good writing is expected. Recall that answers must be well written, documented, justified, and presented to get full credit. What you need to turn in: .Electronic copy of your source program (standalone) Electronic copy of the report (including your answers) (standalone). Submit the file as a Microsoft Word or e. Grading Program is worth 30% if it works and provides data to analyze Quality of the report is worth 70% distributed as follows: good plot (25%), explanations of pl and conclusion (35%). ot (10%), discussio . Objectives of this assignment: To compare the running time performance of InsertSort, QuickSort, and MergeSort. What you need to do: I. Implement the InsertSort, QuickSort, and MergeSort algorithms to sort an array. 2. Collect the execution time T(n) as a function of n for the three algorithms 3. Plot on the same graph the running time of the three algorithms. 4. Discuss the results. Objective: The objective of this programming assignment is to implement in Java the InsertSort, QuickSort, and MergeSort algorithms presented in the lectures to sort a list of numbers. We are interested in comparing the three algorithms. For this exploration, you will collect the execution time T(n) as a function of n and plot on the same graph the execution times T(n) of the three algorithms. Finally, discuss your results. Program to implement collectData () Generate an array G of HUGE length L (as huge as your language allows) with random values capped at 0xfffffffe for n = 10 to L (with step 1,000) for each algorithm InsertSort, QuickSort, and Merge Sort do copy in Array A n first values from ArrayG Start timing // We time the sorting of Array A of length n Sort A using one of the three algorithms. store the value n and the value T(n) in a file F where T(n) is the execution time Data Analysis Use any plotting sofeware (eg, Excel) to plot the values T(n) in File F as a function of n. File F is the file produced by the program you implemented. Discuss your results based on the plots. Report Write a report that will contain, explain, and discuss the plot. The report should not exceed one page. In addition, your report must contain the following information: whether the program works or not (chis must be just ONE sentence) the directions to compile and execute your program o .Good writing is expected. Recall that answers must be well written, documented, justified, and presented to get full credit. What you need to turn in: .Electronic copy of your source program (standalone) Electronic copy of the report (including your answers) (standalone). Submit the file as a Microsoft Word or e. Grading Program is worth 30% if it works and provides data to analyze Quality of the report is worth 70% distributed as follows: good plot (25%), explanations of pl and conclusion (35%). ot (10%), discussio
Step by Step Solution
There are 3 Steps involved in it

Get step-by-step solutions from verified subject matter experts