

Question: Using LucidChart, Word, or Google Draw to complete the following and file upload it into Canvas. 1. Draw a flowchart to represent the logic of
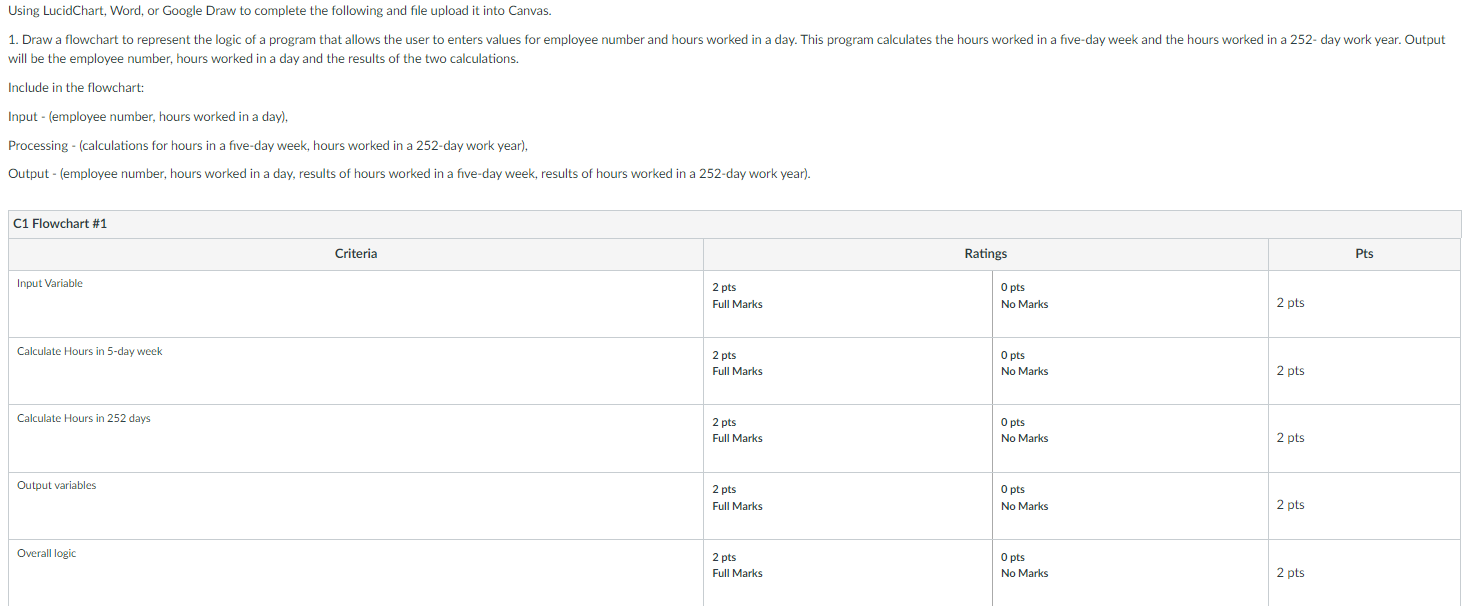
Using LucidChart, Word, or Google Draw to complete the following and file upload it into Canvas. 1. Draw a flowchart to represent the logic of a program that allows the user to enters values for employee number and hours worked in a day. This program calculates the hours worked in a five-day week and the hours worked in a 252-day work year. Output will be the employee number, hours worked in a day and the results of the two calculations. Include in the flowchart: Input - (employee number, hours worked in a day). Processing - (calculations for hours in a five-day week, hours worked in a 252-day work year), Output - (employee number, hours worked in a day, results of hours worked in a five-day week, results of hours worked in a 252-day work year). C1 Flowchart #1 Criteria Ratings Pts Input Variable 2 pts Full Marks O pts No Marks 2 pts Calculate Hours in 5-day week 5- 2 pts Full Marks O pts No Marks 2 pts Calculate Hours in 252 days 2 pts 2 Full Marks O pts No Marks O 2 pts Output variables 2 pts Full Marks O pts No Marks 2 pts Overall logic O pts 2 pts Full Marks No Marks 2 pts
Step by Step Solution
There are 3 Steps involved in it

Get step-by-step solutions from verified subject matter experts