

Question: Using LucidChart, Word, or Google Draw to complete the following and file upload it into Canvas. 1. Draw a flowchart to represent the logic that
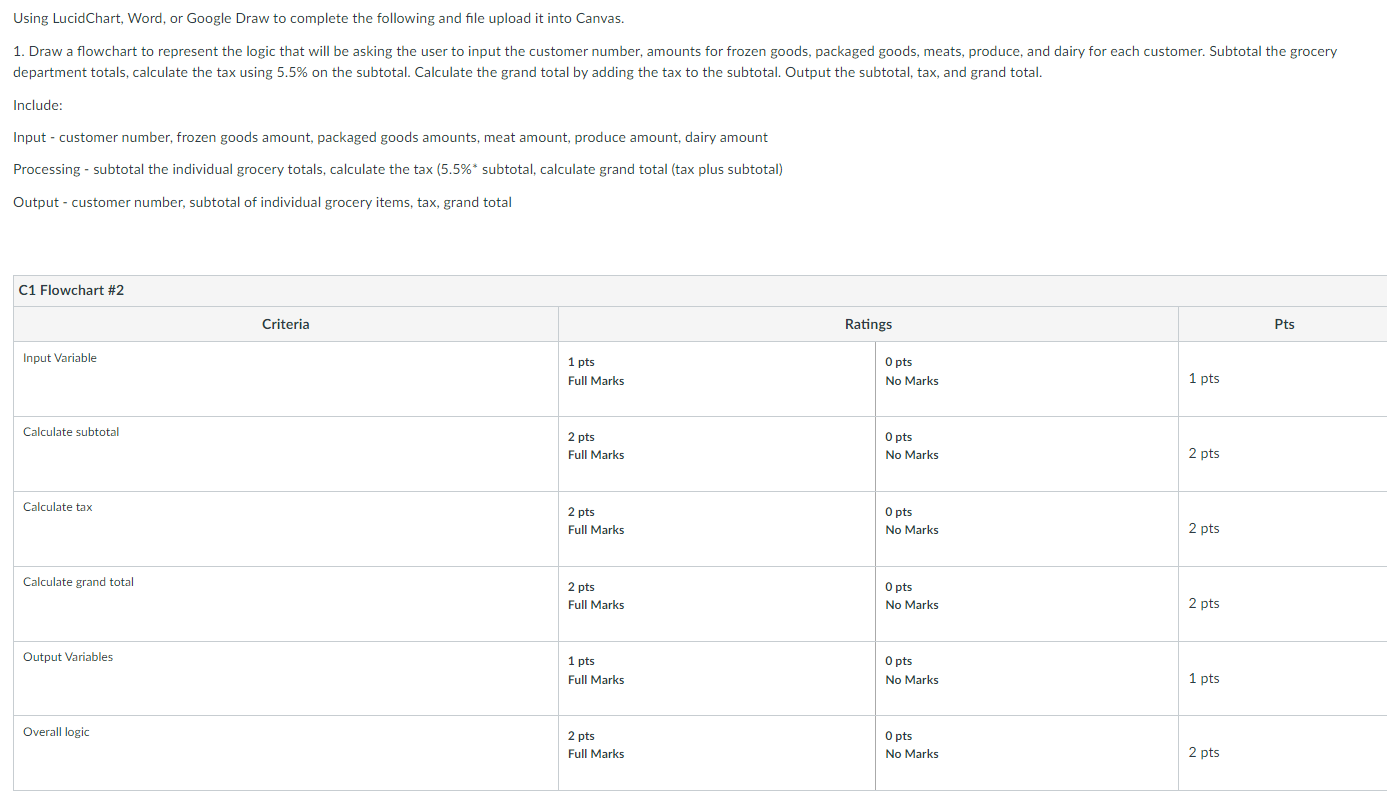
Using LucidChart, Word, or Google Draw to complete the following and file upload it into Canvas. 1. Draw a flowchart to represent the logic that will be asking the user to input the customer number, amounts for frozen goods, packaged goods, meats, produce, and dairy for each customer. Subtotal the grocery department totals, calculate the tax using 5.5% on the subtotal. Calculate the grand total by adding the tax to the subtotal. Output the subtotal, tax, and grand total. Include: Input - customer number, frozen goods amount, packaged goods amounts, meat amount, produce amount, dairy amount Processing - subtotal the individual grocery totals, calculate the tax (5.5%* subtotal, calculate grand total (tax plus subtotal) Output - customer number, subtotal of individual grocery items, tax, grand total C1 Flowchart #2 Criteria Ratings Pts Input Variable 1 pts Full Marks O pts No Marks 1 pts Calculate subtotal 2 pts Full Marks O pts No Marks 2 pts Calculate tax O pts 2 pts Full Marks No Marks 2 pts Calculate grand total 2 pts Full Marks O pts No Marks 2 pts Output Variables O pts 1 pts Full Marks No Marks 1 pts Overall logic 2 pts Full Marks O pts No Marks 2 pts
Step by Step Solution
There are 3 Steps involved in it

Get step-by-step solutions from verified subject matter experts