

Question: using mathematica Here we have the bessel function and we need to plot the graphs of the function for the given p values Using wolfram
using mathematica
Here we have the bessel function and we need to plot the graphs of the function for the given p values
Using wolfram mathematica

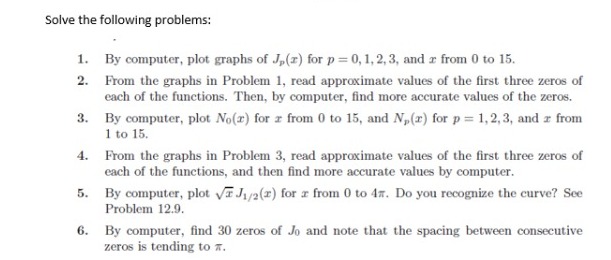
Solve the following problems: 1. By computer, plot graphs of Jp(x) for p = 0, 1, 2,3, and r from 0 to 15. 2. From the graphs in Problem 1, read approximate values of the first three zeros of each of the functions. Then, by computer, find more accurate values of the zeros. 3. By computer, plot No(x) for r from 0 to 15, and No(x) for p = 1, 2,3, and r from 1 to 15. 4. From the graphs in Problem 3, read approximate values of the first three zeros of each of the functions, and then find more accurate values by computer. 5. By computer, plot vi Ja(x) for r from 0 to 4#. Do you recognize the curve? See Problem 12.9. 6. By computer, find 30 zeros of Jo and note that the spacing between consecutive zeros is tending to x
Step by Step Solution
There are 3 Steps involved in it

Get step-by-step solutions from verified subject matter experts