

Question: Using Mathlab write a code that plot the curve of Re vs Cd ! Must be on a log-log scale !please show a picture of
Using Mathlab write a code that plot the curve of Re vs Cd ! Must be on a log-log scale !please show a picture of code aswell
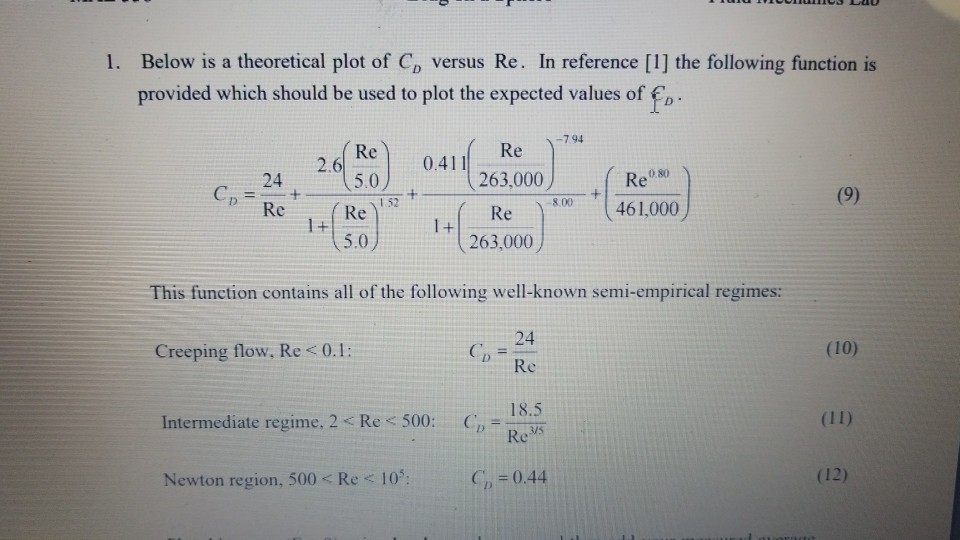
Below is a theoretical plot of CD versus Re. In reference [1] the following function is provided which should be used to plot the expected values of fo 1. )-794 Re 263,000 2.6 0.4 1 11 ( 5.0) Re Re80 "( 461,000 C24 + D 5.0 263,000 This function contains all of the following well-known semi-empirical regimes: Creeping flow, Re
Step by Step Solution
There are 3 Steps involved in it
1 Expert Approved Answer
Step: 1 Unlock

Question Has Been Solved by an Expert!
Get step-by-step solutions from verified subject matter experts
Step: 2 Unlock
Step: 3 Unlock