

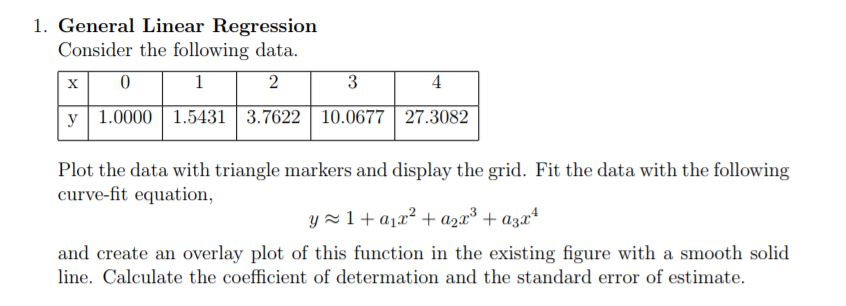
Question: USING MATLAB 1. General Linear Regression Consider the following data 0 y 1.0000 1.54313.7622 10.0677 27.3082 Plot the data with triangle markers and display the
USING MATLAB
1. General Linear Regression Consider the following data 0 y 1.0000 1.54313.7622 10.0677 27.3082 Plot the data with triangle markers and display the grid. Fit the data with the following curve-fit equation and create an overlay plot of this function in the existing figure with a smooth solid line. Calculate the coefficient of determation and the standard error of estimate. 1. General Linear Regression Consider the following data 0 y 1.0000 1.54313.7622 10.0677 27.3082 Plot the data with triangle markers and display the grid. Fit the data with the following curve-fit equation and create an overlay plot of this function in the existing figure with a smooth solid line. Calculate the coefficient of determation and the standard error of estimate
Step by Step Solution
There are 3 Steps involved in it

Get step-by-step solutions from verified subject matter experts