

Question: USING MATLAB 6. Spline Interpolation Create a new figure window and plot the data below with square markers 0 3 y 1.0000 1.54313.7622 10.0677 27.3082
USING MATLAB
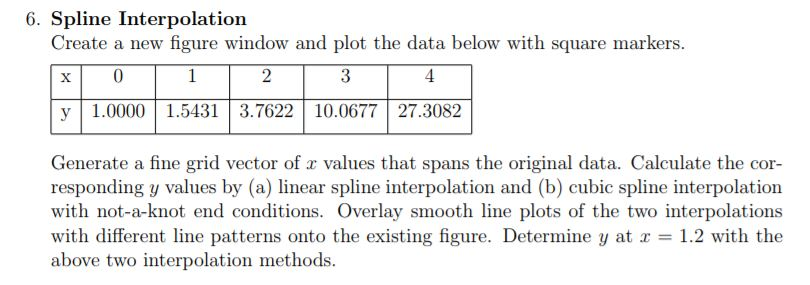
6. Spline Interpolation Create a new figure window and plot the data below with square markers 0 3 y 1.0000 1.54313.7622 10.0677 27.3082 Generate a fine grid vector of values that spans the original data. Calculate the cor responding y values by (a) linear spline interpolation and (b) cubic spline interpolation with not-a-knot end conditions. Overlay smooth line plots of the two interpolations with different line patterns onto the existing figure. Determine y at x = 1.2 with the above two interpolation methods
Step by Step Solution
There are 3 Steps involved in it
1 Expert Approved Answer
Step: 1 Unlock

Question Has Been Solved by an Expert!
Get step-by-step solutions from verified subject matter experts
Step: 2 Unlock
Step: 3 Unlock