

Question: Using Matlab: 3. Fit the following data with the power mode Use the sig power equation to predict y at x = 9: 2.5 3.5
Using Matlab: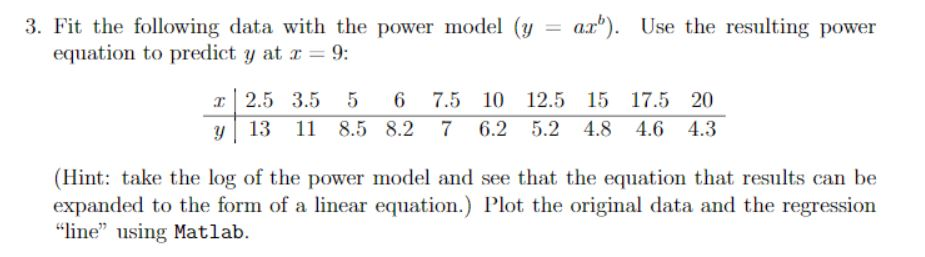
3. Fit the following data with the power mode Use the sig power equation to predict y at x = 9: 2.5 3.5 5 6 7.5 10 12.5 15 17.5 20 y 13 11 8.5 8.2 7 6.2 5.2 4.8 4.6 4.3 (Hint: take the log of the power model and see that the equation that results can be expanded to the form of a linear equation.) Plot the original data and the regression "line" using Matlab
Step by Step Solution
There are 3 Steps involved in it
1 Expert Approved Answer
Step: 1 Unlock

Question Has Been Solved by an Expert!
Get step-by-step solutions from verified subject matter experts
Step: 2 Unlock
Step: 3 Unlock