

Question: Using Matlab 5. Use subplot and a for loop to plot the 1st, 2nd and 3rd order polynomial to the following data. Plot both experimental
Using Matlab 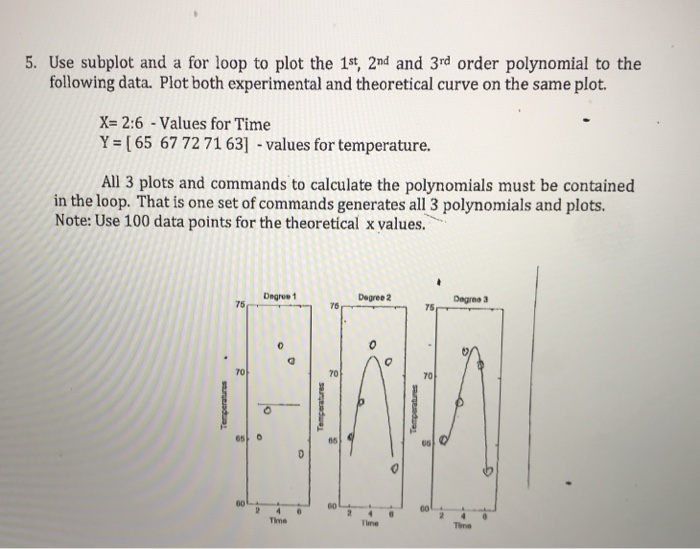
5. Use subplot and a for loop to plot the 1st, 2nd and 3rd order polynomial to the following data. Plot both experimental and theoretical curve on the same plot. X 2:6 -Values for Time Y [65 67 72 71 63] values for temperature. All 3 plots and commands to calculate the polynomials must be contained in the loop. That is one set of commands generates all 3 polynomials and plots. Note: Use 100 data points for the theoretical x yalues. Dagree 1 Degree 2 Dngreo 3 75 76 75 70 70 70 65 05
Step by Step Solution
There are 3 Steps involved in it
1 Expert Approved Answer
Step: 1 Unlock

Question Has Been Solved by an Expert!
Get step-by-step solutions from verified subject matter experts
Step: 2 Unlock
Step: 3 Unlock