

Question: Using MATLAB , complete the following problem: For the given state of stress shown in the figure, generate a graph using MATLAB to explore the
Using MATLAB, complete the following problem:
For the given state of stress shown in the figure, generate a graph using MATLAB to explore the change in normal and shearing stresses as the element is rotated between -90 and 90 degrees. Using this graph, identify and sketch the two conditions where the shearing stresses are zero.
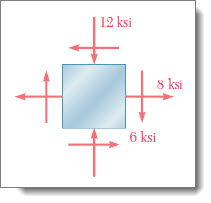
12 ksi 8 ksi 6 ksi 12 ksi 8 ksi 6 ksi
Step by Step Solution
There are 3 Steps involved in it
1 Expert Approved Answer
Step: 1 Unlock

Question Has Been Solved by an Expert!
Get step-by-step solutions from verified subject matter experts
Step: 2 Unlock
Step: 3 Unlock