

Question: Using MATLAB, complete the following problem: For the given state of stress shown in the figure, generate a graph using MATLAB to explore the change
Using MATLAB, complete the following problem:
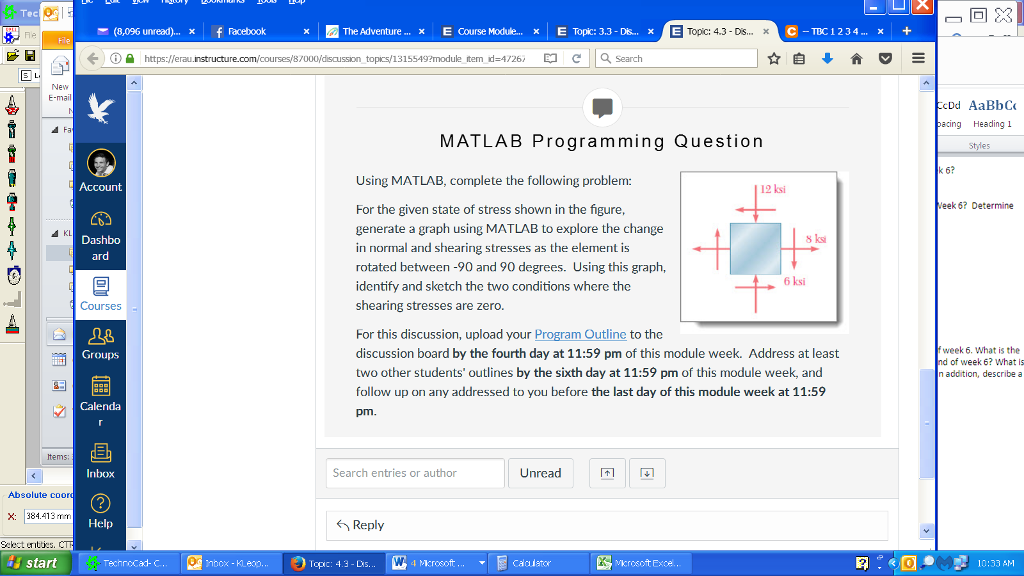
For the given state of stress shown in the figure, generate a graph using MATLAB to explore the change in normal and shearing stresses as the element is rotated between -90 and 90 degrees. Using this graph, identify and sketch the two conditions where the shearing stresses are zero.
HLB 23 Tec (8,096 unread).. xf Facebook The Adventure E Course Module..E Topic: 3.3- Ds... xE ETopic: 4.3-DS... x C - TBC 1234.x+ ne https://erau /000 discussion topics/1315549?module item id-4726 CSearch New E-mail cDd AaBbC acing Heading 1 styles MATLAB Programming Question Using MATLAB, complete the following problem: 12 ksi eek 6? Determine For the given state of stress shown in the figure generate a graph using MATLAB to explore the change in normal and shearing stresses as the element is rotated between -90 and 90 degrees. Using this graph, identify and sketch the two conditions where the shearing stresses are zero KL s ks 6 ksi For this discussion, upload your Program Outline to the discussion board by the fourth day at 11:59 pm of this module week. Address at least two other students' outlines by the sixth day at 11:59 pm of this module week, and follow up on any addressed to you before the last day of this module week at 11:59 pm. week 6. What is the d of week 6? What is n addition, describe a Groups Calenda tems Inbox Search entries or author Unread Absolute coor Help Reply start Iopic: 4.3 - Lis. 4 Mcrosoft... 10:33
Step by Step Solution
There are 3 Steps involved in it

Get step-by-step solutions from verified subject matter experts