

Question: Using MATLAB complete the steps below and submit the required plots. 1) Load the observations, Cx Matrix, and Cn Matrix stored in the ASCII
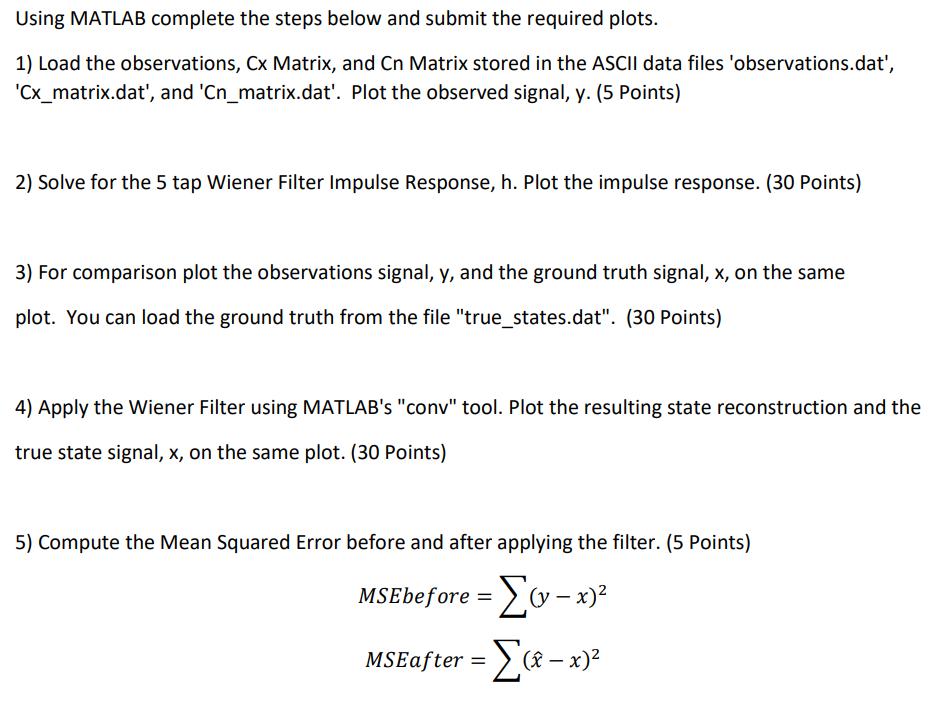
Using MATLAB complete the steps below and submit the required plots. 1) Load the observations, Cx Matrix, and Cn Matrix stored in the ASCII data files 'observations.dat', 'Cx_matrix.dat', and 'Cn_matrix.dat'. Plot the observed signal, y. (5 Points) 2) Solve for the 5 tap Wiener Filter Impulse Response, h. Plot the impulse response. (30 Points) 3) For comparison plot the observations signal, y, and the ground truth signal, x, on the same plot. You can load the ground truth from the file "true_states.dat". (30 Points) 4) Apply the Wiener Filter using MATLAB's "conv" tool. Plot the resulting state reconstruction and the true state signal, x, on the same plot. (30 Points) 5) Compute the Mean Squared Error before and after applying the filter. (5 Points) MSEbefore = (v- x) MSEafter = [(-x)
Step by Step Solution
3.53 Rating (163 Votes )
There are 3 Steps involved in it
Certainly Below is a MATLAB script that accomplishes the tasks youve outlined Make sure to have the ... View full answer

Get step-by-step solutions from verified subject matter experts