

Question: USING MATLAB ECE 203: Introduction to MATLAB Programming Assignment 2 (20 Points) 1. Create a new live script file run_max_min_2D_plot.mlx 2. Make sure to clear
USING MATLAB
ECE 203: Introduction to MATLAB Programming Assignment 2 (20 Points)
1. Create a new live script file run_max_min_2D_plot.mlx
2. Make sure to clear all variables and close all figure windows
3. Create a linearly spaced array x of size (1 2500) comprising values ranging from to
4. Compute y1 as shown in the below equation: 1 = sin(2)
5. Create a new figure window
6. Plot x vs. y1 in blue and choose a style
7. Compute y2 as shown in the below equation 2 = cos( 2 )
8. Plot x vs. y2 in magenta on the same figure window
9. Compute y as shown in the below equation = sin(2) cos( 2 )
10.Plot x vs. y in red and choose a style on the same figure window
11.Label the x-axis as Theta (in radians) and y-axis as Function Values
12.Provide title to the figure Maximum and Minimum Plotting
13.Set the x-axis limits as - to and y-axis limits as -1 to 1
14.Determine the maximum and minimum values of y1,y2,y and determine the corresponding indices of x
15.Plot the maximum and minimum values on the same plot as shown in Figure 1
16.Make sure to label the plots as shown in Figure 1
17.Make sure to switch on the grid on the figure window and comment your code accordingly
18.Display the maximum and minimum value of each function using fprintf() Your result should look like Figure 1. However, the style of the plot can vary
s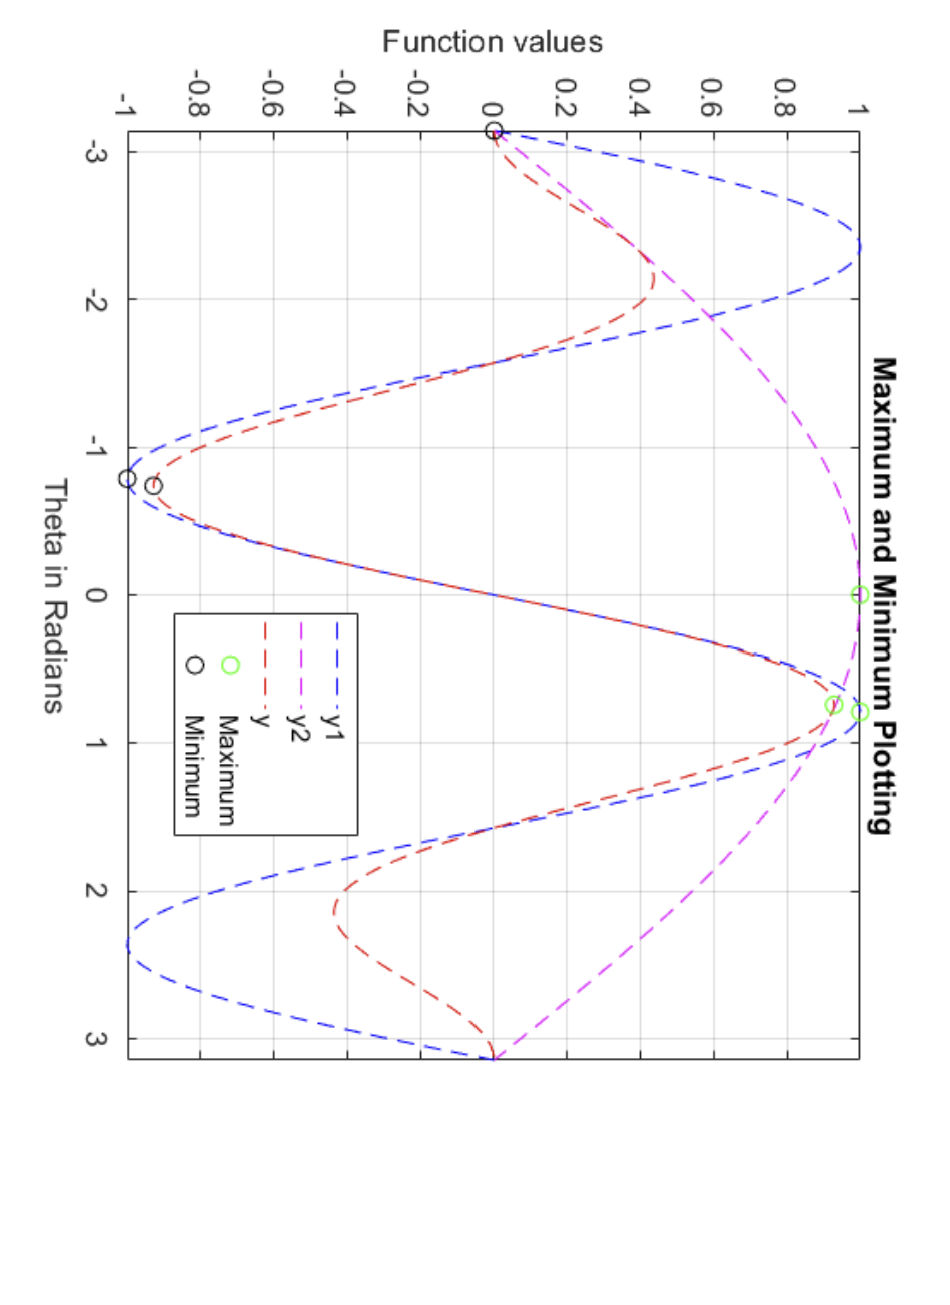
Theta in Radians
Step by Step Solution
There are 3 Steps involved in it

Get step-by-step solutions from verified subject matter experts