

Question: USING MATLAB. Here are some wind tunnel data for force (F) versus velocity (v): 40 80 v, m/s 10 20 30 50 EN 25 70
USING MATLAB.
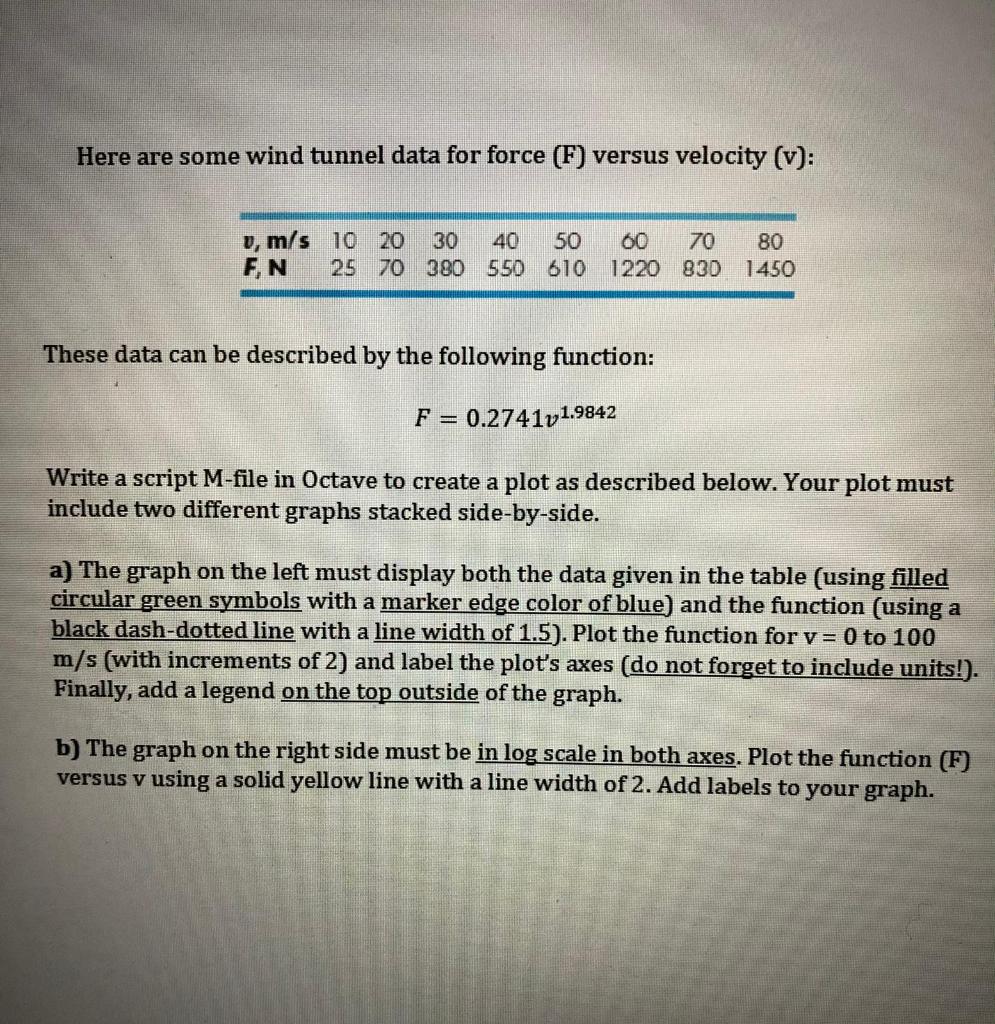
Here are some wind tunnel data for force (F) versus velocity (v): 40 80 v, m/s 10 20 30 50 EN 25 70 380 550 610 00 70 1220 800 1.450 These data can be described by the following function: F = 0.2741v1.9842 Write a script M-file in Octave to create a plot as described below. Your plot must include two different graphs stacked side-by-side. a) The graph on the left must display both the data given in the table (using filled circular green symbols with a marker edge color of blue) and the function (using a black dash-dotted line with a line width of 1.5). Plot the function for v= 0 to 100 m/s (with increments of 2) and label the plot's axes (do not forget to include units!). Finally, add a legend on the top outside of the graph. b) The graph on the right side must be in log scale in both axes. Plot the function (F) versus v using a solid yellow line with a line width of 2. Add labels to your graph
Step by Step Solution
There are 3 Steps involved in it

Get step-by-step solutions from verified subject matter experts