

Question: Using MATLAB Next, plot the following functions: x(9) = 50 sin and y(0) 200sin 6. Plot both of these functions on the same plot with
Using MATLAB 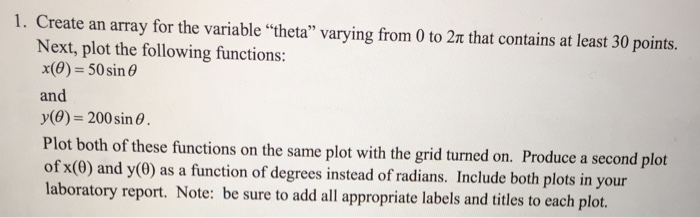
Next, plot the following functions: x(9) = 50 sin and y(0) 200sin 6. Plot both of these functions on the same plot with the grid turned on. Produce a second plot of x(0) and y(0) as a function of degrees instead of radians. Include both plots in your laboratory report. Note: be sure to add all appropriate labels and titles to each plot
Step by Step Solution
There are 3 Steps involved in it
1 Expert Approved Answer
Step: 1 Unlock

Question Has Been Solved by an Expert!
Get step-by-step solutions from verified subject matter experts
Step: 2 Unlock
Step: 3 Unlock