

Question: USING MATLAB PLEASE For the following data Plot the data points with a circle marker Plot the unique interpolating polynomial (passes exactly through each point)
USING MATLAB PLEASE
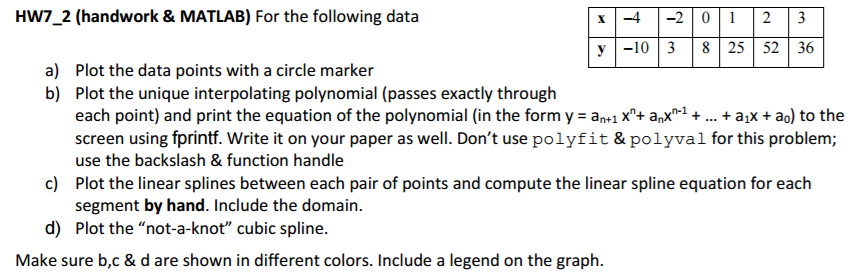
For the following data Plot the data points with a circle marker Plot the unique interpolating polynomial (passes exactly through each point) and print the equation of the polynomial (in the form y = a_n + 1 x^n + a_n x^n-1 + .... + a_1x + a_0) to the screen using fprintf. Write it on your paper as well. Don't use polyfit & polyval for this problem use the backslash & function handle Plot the linear splines between each pair of points and compute the linear spline equation for each segment by hand. Include the domain. Plot the "not-a-knot" cubic spline. Make sure b, c & d are shown in different colors. Include a legend on the graph
Step by Step Solution
There are 3 Steps involved in it

Get step-by-step solutions from verified subject matter experts