

Question: I need help finding out why my code will not work. It was working just fine as I have it and then all of a
I need help finding out why my code will not work. It was working just fine as I have it and then all of a sudden it is giving me an error "Undefined function or variable 'p1'
Do I need to explicitly put what the points are for p1, p2, p3? I've copy and pasted the code I am using below the question. Can you tell me what part is wrong that is not allowing me to get the circle? I've double checked everything. It is saved correctly under "mycirc.m". Not sure what to do.
function [ z ] = mycirc( p1,p2,p3 ) %Finds parameters of the circle that passes through the points %p1,p2,p3 if such a circle exists and draws it B=zeros(3,3); B(:,3)=[1;1;1]; B(1,1:2)=p1; B(2,1:2)=p2; B(3,1:2)=p3;
if (det(B)==0) %det B is area of triangle formed by points disp('No such circle exists') %if area is zero, no such circle exists return; end
A(1,:)=[2*p1(1),2*p1(2),-1]; A(2,:)=[2*p2(1),2*p2(2),-1]; A(3,:)=[2*p3(1),2*p3(2),-1]; %populate coefficient matrix
b=[p1(1)^2+p1(2)^2;p2(1)^2+p2(2)^2;p3(1)^2+p3(2)^2]; %populate constant matrix
z=inv(A)*b; %find solution h=z(1); k=z(2); p=z(3); %assign variables r=sqrt(h^2+k^2-p);%find circle radius
scatter([p1(1),p2(1),p3(1)],[p1(2),p2(2),p3(2)],'*g')%plot points as green stars hold on
plot(h,k,'dr') %plot red diamond center viscircles([h,k],r,'Color','m') %plot circle axis equal %so circle doesn't appear squished end
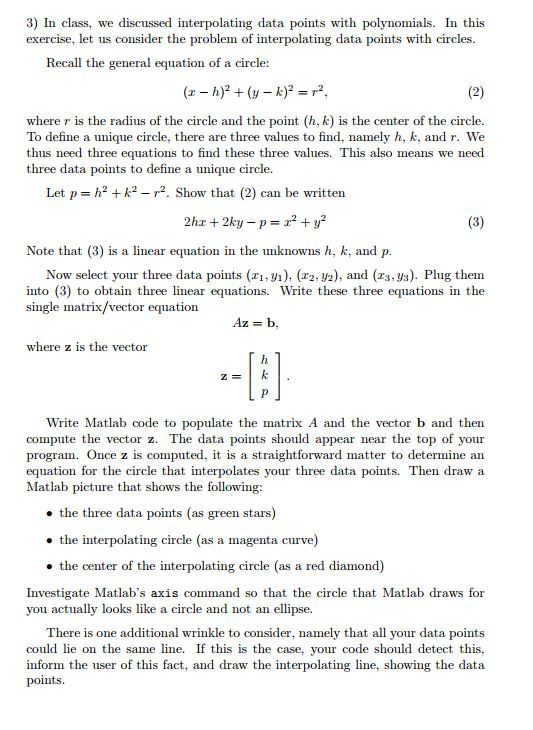
3) In class, we discussed interpolating data points with polynomials. In this exercise, let us consider the problem of interpolating data points with circles Recall the general equation of a circle: where r is the radius of the circle and the point (h, k) is the center of the circle To define a unique circle, there are three values to find, namely h, k, and r. We thus need three equations to find these three values. This also means we need three data points to define a unique circle Let p h2k2 2. Show that(2) can be written Note that (3) is a linear equation in the unknowns h, k, and p into (3) to obtain three linear equation single matrix/vector equation Now select your three data points (r,v), (2, y2), and (z3, ys). Plug them equations in the Write these three where z is the vector Z E Write Matlab code to populate the matrix A and the vector b and then compute the vector z. The data points should appear near the top of your program. Once z is computed, it is a straightforward matter to determine an equation for the circle that interpolates your three data points. Then draw a Matlab picture that shows the following: the three data points (as green stars) the interpolating circle (as a magenta curve) the center of the interpolating circle (as a red diamond) Investigate Matlab's axis command so that the circle that Matlab draws for you actually looks like a circle and not an ellipse There is one additional wrinkle to consider, namely that all your data points could lie on the samene. If this is the case, your code should detect this, inform the user of this fact, and draw the interpolating line, showing the data points
Step by Step Solution
There are 3 Steps involved in it

Get step-by-step solutions from verified subject matter experts