

Question: Using Matlab please help solving 13.2, comments needed ( use same data from 13.1) Problem 13.2 ata from Problem 13.1 I and linear interpolation to
Using Matlab please help solving 13.2, comments needed ( use same data from 13.1)
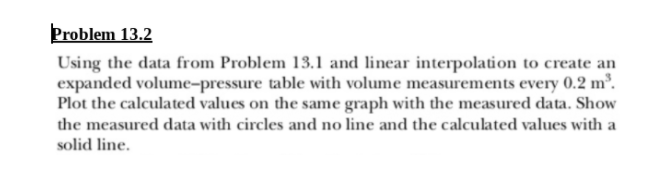
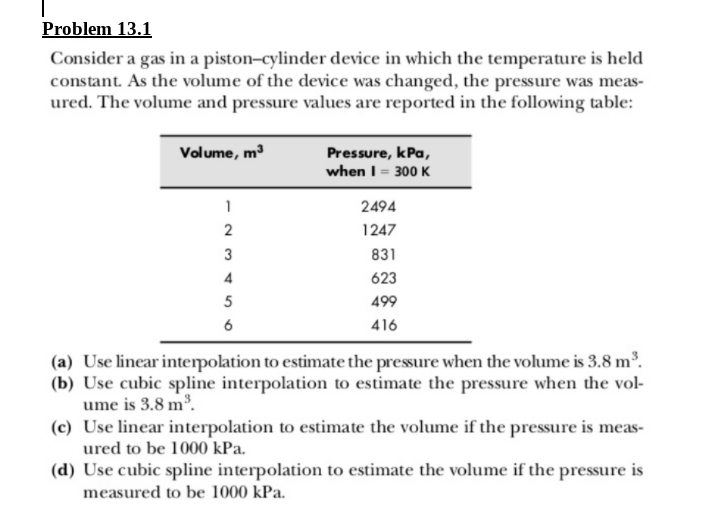
Problem 13.2 ata from Problem 13.1 I and linear interpolation to create an li expanded volume-pressure table with volume measurements every 0.2 m Plot the calculated values on the same graph with the measured data. Shovw the measured data with circles and no line and the calculated values with a solid line
Step by Step Solution
There are 3 Steps involved in it
1 Expert Approved Answer
Step: 1 Unlock

Question Has Been Solved by an Expert!
Get step-by-step solutions from verified subject matter experts
Step: 2 Unlock
Step: 3 Unlock