

Question: Using Matlab, please send the solutions in the form of images, as well as writing that can be copied and pasted Homework 1. Plot sin(x)
 Using Matlab, please send the solutions in the form of images, as well as writing that can be copied and pasted
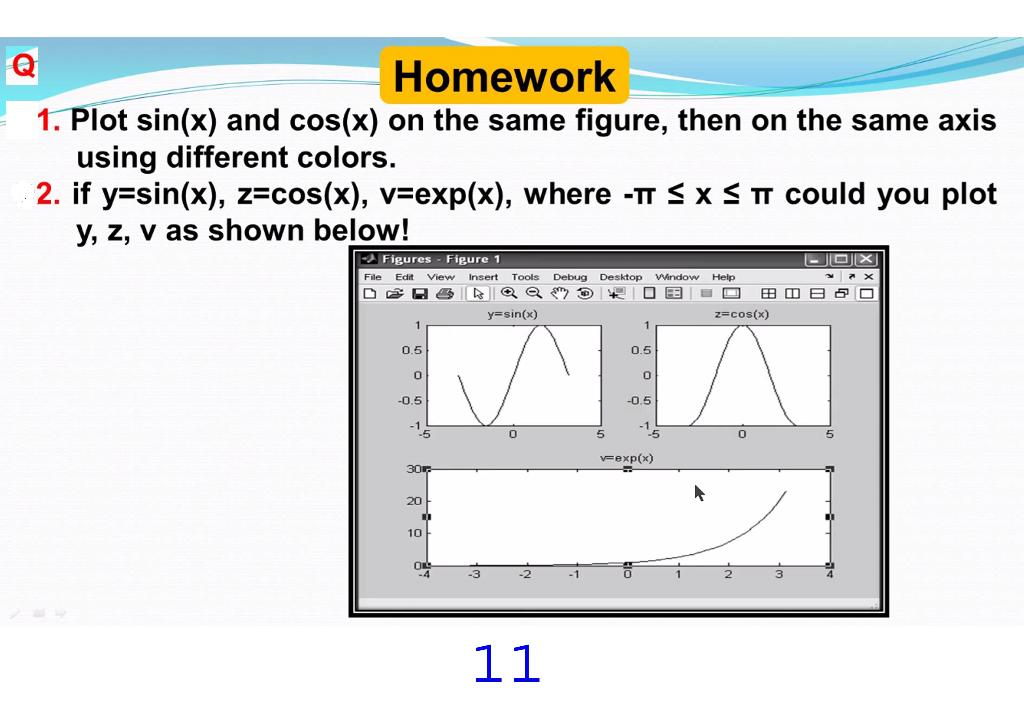
Homework 1. Plot sin(x) and cos(x) on the same figure, then on the same axis using different colors. 2. if y=sin(x), z=cos(x), v=exp(x), where -I SXSI could you plot y, z, v as shown below! OX -Figures Figure 1 File Edit View Insert Tools Debug Desktop Window Help U y=sin(x) z=cos(x) 1 0.5 0.5 0 0 -0.5 -0.5 -1 0 0 v=exp(x) 30 20 10 OR -1 11
Step by Step Solution
There are 3 Steps involved in it
1 Expert Approved Answer
Step: 1 Unlock

Question Has Been Solved by an Expert!
Get step-by-step solutions from verified subject matter experts
Step: 2 Unlock
Step: 3 Unlock