

Question: (Using Matlab please)We are given data about a charity organization in table 1 Days 10 20 30 40 50 60 70 80 90 100 Donation
(Using Matlab please)We are given data about a charity organization in table 1 Days 10 20 30 40 50 60 70 80 90 100 Donation 23 45 60 82 111 140 167 198 200 220 Table 1: Donation collection by the charity organization Assume that x corresponds to the independent variable. Compute linear, quadratic and cubic fit for the data using regression techniques and plot them on three different graphs, all on the same figure. Use an appropriate small interval to create your plots. Mark the original data with green circles. Give appropriate titles and labels for the graph. Explain in few sentences which model best represents the data and why? Now, use the best model to find the value of the donation collection for 25th day. Print this value.
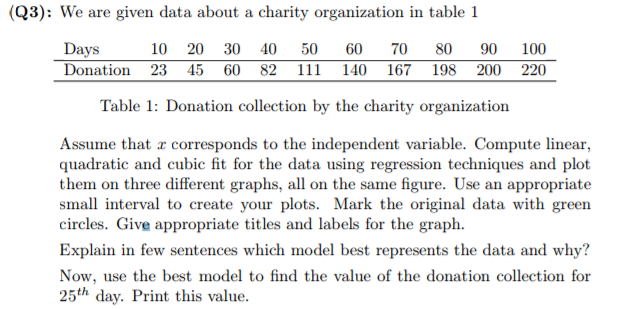
(Q3): We are given data about a charity organization in table 1 Days 10 20 30 40 50 60 70 80 90 100 Donation 23 45 60 82 111 140 167 198 200 220 Table 1: Donation collection by the charity organization Assume that r corresponds to the independent variable. Compute linear, quadratic and cubic fit for the data using regression techniques and plot them on three different graphs, all on the same figure. Use an appropriate sma interval to create your plots. Mark the original data with green circles. Give appropriate titles and labels for the graph. Explain in few sentences which model best represents the data and why? Now, use the best model to find the value of the donation collection for 25th day. Print this value
Step by Step Solution
There are 3 Steps involved in it

Get step-by-step solutions from verified subject matter experts