

Question: Using matlab plot the coordiantes x and y in the horizontal place, and the stresses in the vertical direction of the stress fields given below.
Using matlab plot the coordiantes x and y in the horizontal place, and the stresses in the vertical direction of the stress fields given below.
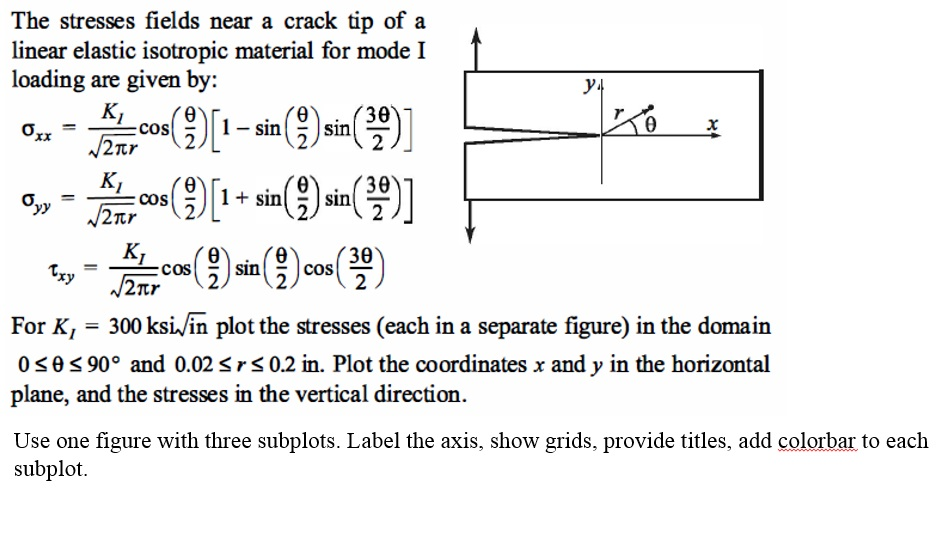
The stresses fields near a crack tip of a linear elastic isotropic material for mode I loading are given by: 30 sin sin cos A/2Tr e) 30 I sin sin COS 20) CoS sin cos xy For K 300 ksivin plot the stresses (each in a separate figure) in the domain 0 s 0 s 90 and 0.02 s r s 0.2 in. Plot the coordinates x and y in the horizontal plane, and the stresses in the vertical direction. Use one figure with three subplots. Label the axis, show grids, provide titles, add colorbar to each subplot
Step by Step Solution
There are 3 Steps involved in it
1 Expert Approved Answer
Step: 1 Unlock

Question Has Been Solved by an Expert!
Get step-by-step solutions from verified subject matter experts
Step: 2 Unlock
Step: 3 Unlock