

Question: Using matlab, plot the function f(x,y)=F1(x,y)+F2(x,y) where both F1(x,y) and F2(x,y) are 2-dimensional Gaussian functions with the following mean value and covariance matrices: 1) 1=[22]1=[1002]
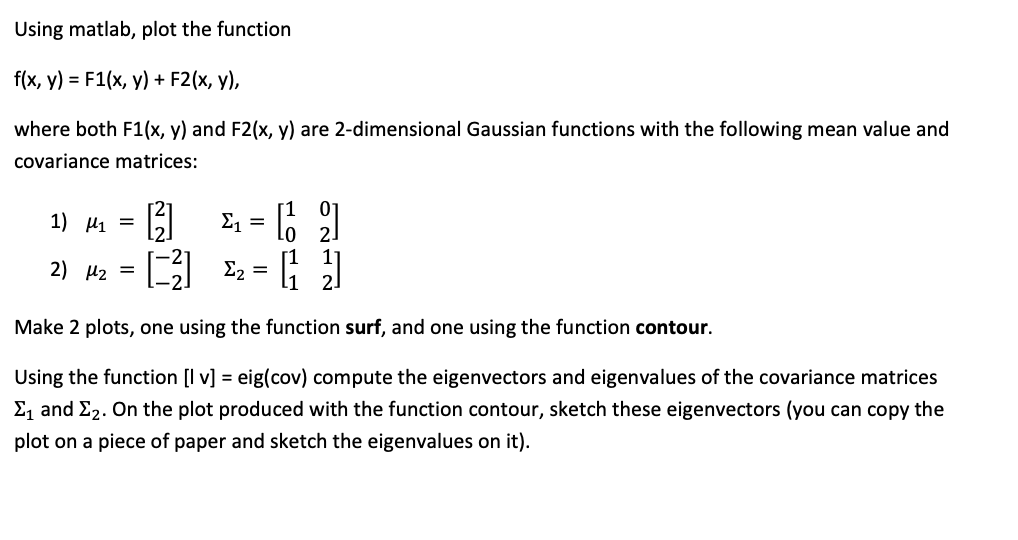
Using matlab, plot the function f(x,y)=F1(x,y)+F2(x,y) where both F1(x,y) and F2(x,y) are 2-dimensional Gaussian functions with the following mean value and covariance matrices: 1) 1=[22]1=[1002] 2) 2=[22]2=[1112] Make 2 plots, one using the function surf, and one using the function contour. Using the function [I v] = eig(cov) compute the eigenvectors and eigenvalues of the covariance matrices 1 and 2. On the plot produced with the function contour, sketch these eigenvectors (you can copy the plot on a piece of paper and sketch the eigenvalues on it)
Step by Step Solution
There are 3 Steps involved in it
1 Expert Approved Answer
Step: 1 Unlock

Question Has Been Solved by an Expert!
Get step-by-step solutions from verified subject matter experts
Step: 2 Unlock
Step: 3 Unlock