

Question: Using Matlab, Plot the mathematical expression given below. Label the x - axis as time in secs and y - axis as amplitude Generate t
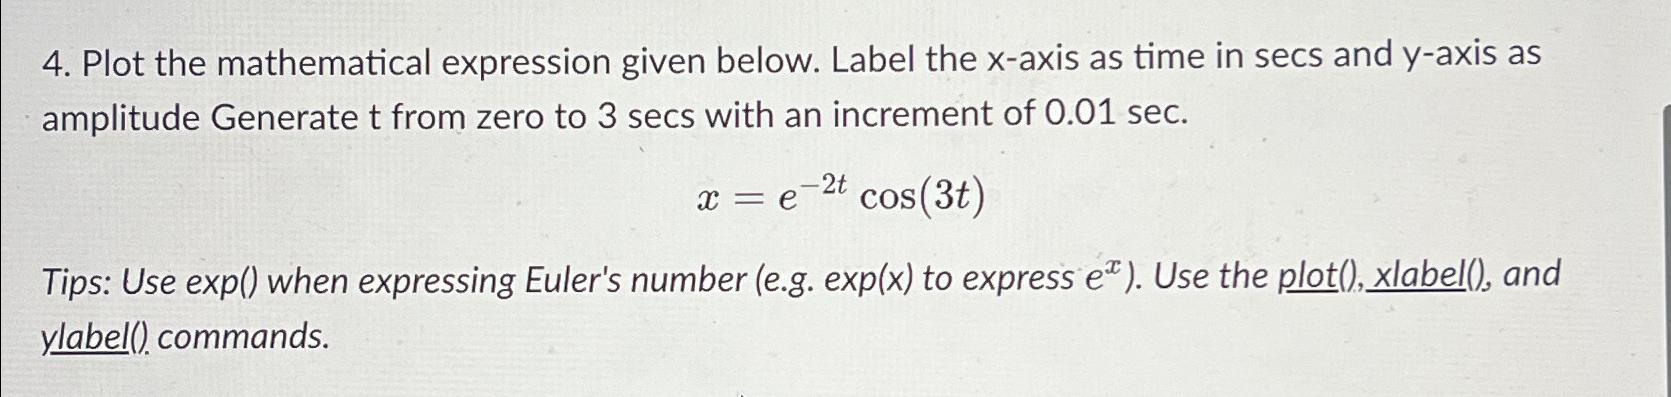
Using Matlab, Plot the mathematical expression given below. Label the axis as time in secs and axis as amplitude Generate from zero to secs with an increment of
Tips: Use when expressing Euler's number eg exp to express : Use the plot label and ylabel commands.
Step by Step Solution
There are 3 Steps involved in it
1 Expert Approved Answer
Step: 1 Unlock

Question Has Been Solved by an Expert!
Get step-by-step solutions from verified subject matter experts
Step: 2 Unlock
Step: 3 Unlock