

Question: Using Matlab, plot the simulated sum distributions for rolling 1, 2, 3, 6, 40 dice and compare with a Gaussian with a mean of N1d
Using Matlab, plot the simulated sum distributions for rolling 1, 2, 3, 6, 40 dice and compare with a Gaussian with a mean of N1d and a standard deviation of N1d. The plots should look similar to those below: 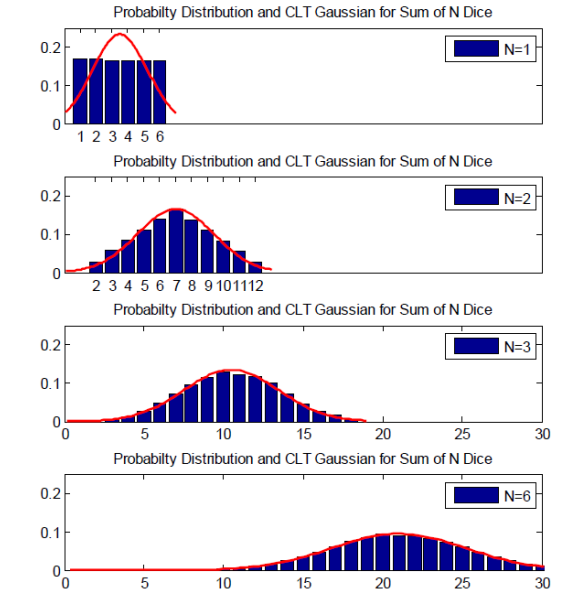
Probabilty Distribution and CLT Gaussian for Sum of N Dice 0.2 0.1 0 N-1 1 2 34 5 6 Probabilty Distribution and CLT Gaussian for Sum of N Dice 0.2 N-2 0.1 2 3456789 101112 Probabilty Distribution and CLT Gaussian for Sum of N Dice 0.2 0.1 5 10 15 Probabilty Distribution and CLT Gaussian for Sum of N Dice 20 25 30 0.2 15 20 25 30
Step by Step Solution
There are 3 Steps involved in it
1 Expert Approved Answer
Step: 1 Unlock

Question Has Been Solved by an Expert!
Get step-by-step solutions from verified subject matter experts
Step: 2 Unlock
Step: 3 Unlock