

Question: PLEASE ANSWER QUESTION 6 FROM WRITTEN PORTION Times New 12 QQ Norma | | | | The following data are from a study of gender-related
PLEASE ANSWER QUESTION 6 FROM WRITTEN PORTION
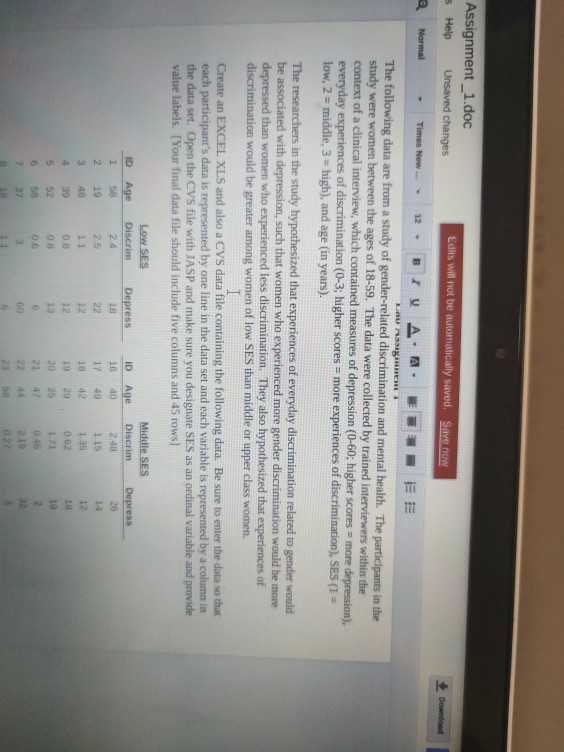
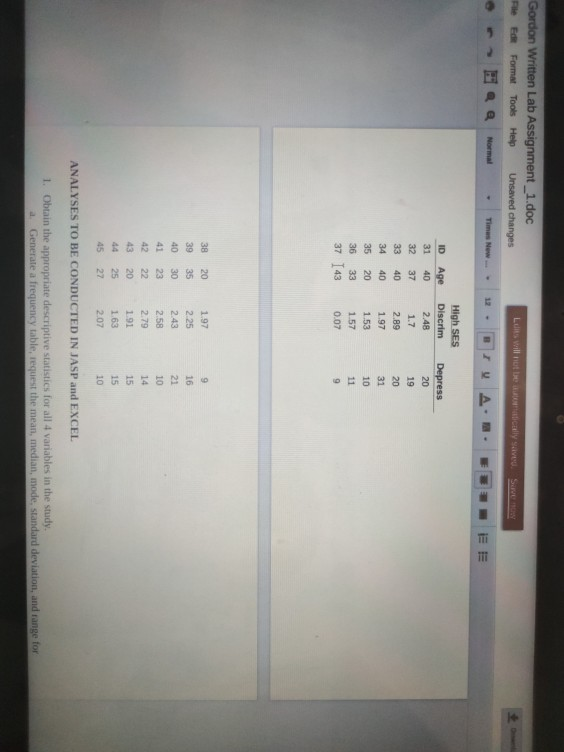
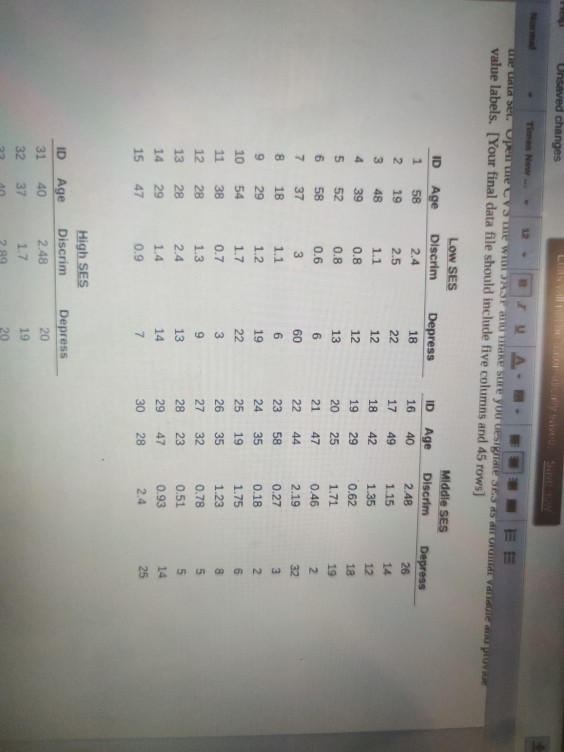
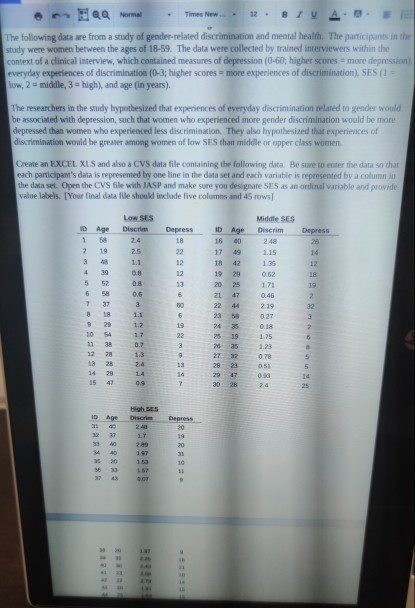
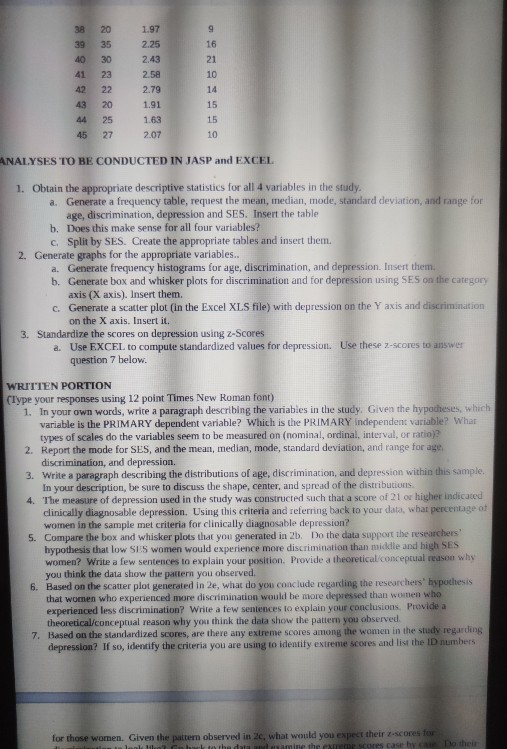
Times New 12 QQ Norma | | | | The following data are from a study of gender-related discrimination and mental health. The participants in the study were women between the age of 18-59. The data were collected by trained interviewers within the context of a clinical interview, which contained measures of depression (0-60; higher scores = more depression), everyday experiences of discrimination (0-3; higher scores = more experiences of discrimination). SES (1 = low, 2 = middle, 3 high), and age (in years). The researchers in the study hypothesized that experiences of everyday discrimination related to gender would be associated with depression, such that women who experienced more gender discrimination would be more depressed than women who experienced less discrimination. They also hypothesized that experiences of discrimination would be greater among women of low SES than middle or upper class women Create an EXCEL XLS and also a CVS data file containing the following dita. Be sure to enter the data so chat each participant's data is represented by one line in the data set and each variable is represented by a column the data set. Open the CVS file with JASP and make sure you designate SES as an ordinal variable and provide value labels. [Your final data file should include five columns and 45 rows] ID 16 Low SES Discrim 2.4 25 11 10 1 2 3 Age 40 Age 58 19 AR 39 Depress 28 14 12 17 49 29 25 5 6 58 JT 0.6 3 1.1 Depress 1A 22 12 12 13 6 60 6 19 22 3 8 Middle SES Discrim 2.48 115 1.35 0.62 1.71 0.46 2.19 027 0.18 1.75 1.23 0.78 0.51 0.93 2.4 18 19 2 32 3 2 44 22 23 58 1.2 18 29 10 54 11 38 78 13 28 6 0.7 19 35 2732 28 23 29 47 3028 5 5 14 15 0.9 7 10 Age Disc 24 17 299 37 40 DERRNER Depress 20 19 20 31 10 LI 1.53 20 23 36 0.0 TE 9 38 39 40 20 35 30 23 22 20 25 27 1.97 2.25 2.43 2.58 2.79 1.91 1.63 2.07 42 16 21 10 14 15 15 10 43 44 45 ANALYSES TO BE CONDUCTED IN JASP and EXCEL 1. Obtain the appropriate descriptive statistics for all 4 variables in the study. a. Generate a frequency table, request the mean, median, mode, standard deviation, and range for age, discrimination, depression and SES. Insert the table b. Does this make sense for all four variables? c. Split by SES. Create the appropriate tables and insert them 2. Generate graphs for the appropriate variables.. a. Generate frequency histograms for age, discrimination, and depression. Insert them. b. Generate box and whisker plots for discrimination and for depression using SES on the category axis (X axis). Insert them. c. Generate a scatter plot (in the Excel XLS file) with depression on the Y axis and discrimination on the X axis. Insert it, 3. Standardize the scores on depression using 2-Scores a. Use EXCEL to compute standardized values for depression. Use these 2-scores to answer question 7 below. WRITTEN PORTION Clype your responses using 12 point Times New Roman font) 1. In your own words, write a paragraph describing the variables in the study. Given the hypotheses, which variable is the PRIMARY dependent variable? Which is the PRIMARY independent variable? What types of scales do the variables seem to be measured on (nominal, ordinal, interval, or ratio) 2. Report the mode for SES, and the mean, median, mode, standard deviation, and range for age discrimination, and depression. 3. Write a paragraph describing the distributions of age, discrimination, and depression within this sample. In your description, be sure to discuss the shape, center, and spread of the distributions. 4. The measure of depression used in the study was constructed such that a score of 21 or higher indicated clinically diagnosable depression. Using this criteria and referring back to your data, what percentage at women in the sample met criteria for clinically diagnosable depression? 5. Compare the box and whisker plots that you generated in 2b. Do the data support the researchers hypothesis that low SES women would experience more discrimination than middle and high SES women? Write a few sentences to explain your position. Provide a theoretical conceptual reason why you think the data show the pattern you observed, 6. Based on the scatter plot generated in 2e, what do you conclude regarding the researchers' hypothesis that women who experienced more discrimination would be more depressed than women who experienced less discrimination? Write a few sentences to explain your conclusions. Provide a theoretical/conceptual reason why you think the data show the pattern you observed 7. Based on the standardized scores, are there any extreme scores among the women in the study regarding depression? If so, identify the criteria you are using to identify extreme scores and list the ID numbers for those women. Given the pattern observed in 2c, what would you expect their 2-scores for lool lillah to the datamine the extreme ces case by Do the Assignment_1.doc $ Help Unsaved changes Edits will not be automatically saved. Save now Download Times New LAUREA Normal BIV A. A The following data are from a study of gender-related discrimination and mental health. The participants in the study were women between the ages of 18-59. The data were collected by trained interviewers within the context of a clinical interview, which contained measures of depression (0-60; higher scores = more depression), everyday experiences of discrimination (0-3; higher scores = more experiences of discrimination), SES (1 = low, 2 = middle, 3 = high), and age (in years). The researchers in the study hypothesized that experiences of everyday discrimination related to gender would be associated with depression, such that women who experienced more gender discrimination would be more depressed than women who experienced less discrimination. They also hypothesized that experiences of discrimination would be greater among women of low SES than middle or upper class women. Create an EXCEL XLS and also a CVS data file containing the following data. Be sure to enter the data so that each participant's data is represented by one line in the data set and each variable is represented by a column in the data set. Open the CVS file with JASP and make sure you designate SES as an ordinal variable and provide value labels. [Your final data file should include five columns and 45 rows] ID 1 Age 40 ID 16 17 18 Depress 26 14 12 2 Middle SES Discrim 2.48 115 1.35 0.62 49 Age 58 19 48 39 52 58 37 3 Low SES Discrim 2.4 25 11 08 08 0 3 11 Depress 18 22 12 12 13 6 60 4 19 20 5 6 25 4 44 2 32 2 Gordon Written Lab Assignment_1.doc eFdFormatTools Help Unsaved changes Luis will not be cally saved. Suve Times New 12 BIA JE E ID Age 31 32 33 40 37 40 40 20 33 High SES Discrim 2.48 1.7 2.89 1.97 1.53 1.57 0.07 Depress 20 19 20 31 10 11 34 35 36 37 143 9 38 20 39 35 40 30 41 23 42 22 43 20 25 45 27 1.97 2.25 2.43 2.58 2.79 191 1.63 9 16 21 10 14 15 15 2.07 10 ANALYSES TO BE CONDUCTED IN JASP and EXCEL 1. Obtain the appropriate descriptive statistics for all 4 variables in the study. a. Generate a frequency table, request the mean, median, mode, standard deviation, and range for Unsaved changes 12 TA EE we wataset opene sme WDASE MAKE SURE your design as dit onde van de provide value labels. [Your final data file should include five columns and 45 rows] ID 1 LOW SES Discrim 2.4 Age 58 19 ID Depress 16 Depress 18 22 12 Age 40 49 26 N 2.5 14 3 48 1.1 17 18 19 12 4 39 0.8 12 42 29 25 5 0.8 13 20 6 52 58 37 0.6 6 21 47 19 2 32 7 3 44 60 6 Middle SES Discrim 2.48 1.15 1.35 0.62 1.71 0.46 2.19 0.27 0.18 1.75 1.23 0.78 0.51 0.93 2.4 22 23 B 18 58 1.1 1.2 9 29 19 35 24 25 10 54 1.7 22 19 6 8 38 0.7 3 26 11 12 13 28 1.3 9 27 35 32 23 2.4 13 28 5 28 29 14 29 47 14 1.4 0.9 14 7 15 47 30 28 25 ID Age 40 High SES Discrim 2.48 31 32 Depress 20 19 20 1.7 28 a. Use EXCEL to compute standardized values for depression. Use these z-scores to answer question 7 below. WRITTEN PORTION (Type your responses using 12 point Times New Roman font) 1. In your own words, write a paragraph describing the variables in the study. Given the hypotheses, which variable is the PRIMARY dependent variable? Which is the PRIMARY independent variable? What types of scales do the variables seem to be measured on (nominal, ordinal, interval, or ratio)? 2. Report the mode for SES, and the mean, median, mode, standard deviation, and range for age, discrimination, and depression. 3. Write a paragraph describing the distributions of age, discrimination, and depression within this sample. In your description, be sure to discuss the shape, center, and spread of the distributions. 4. The measure of depression used in the study was constructed such that a score of 21 or higher indicated clinically diagnosable depression. Using this criteria and referring back to your data, what percentage of women in the sample met criteria for clinically diagnosable depression? 5. Compare the box and whisker plots that you generated in 2b. Do the data support the researchers hypothesis that low SES women would experience more discrimination than middle and high SES worpen? Write a few sentences to explain your position. Provide a theoretical/conceptual reason why you think the data show the pattern you observed. 6. Based on the scatter plot generated in 2e, what do you conclude regarding the researchers' hypothesis that women who experienced more discrimination would be more depressed than women who experienced less discrimination? Write a few sentences to explain your conclusions. Provide a theoretical/conceptual reason why you think the data show the pattern you observed. 7. Based on the standardized scores, are there any extreme scores among the women in the study regarding depression? If so, identify the criteria you are using to identify extreme scores and list the ID numbers Times New 12 QQ Norma | | | | The following data are from a study of gender-related discrimination and mental health. The participants in the study were women between the age of 18-59. The data were collected by trained interviewers within the context of a clinical interview, which contained measures of depression (0-60; higher scores = more depression), everyday experiences of discrimination (0-3; higher scores = more experiences of discrimination). SES (1 = low, 2 = middle, 3 high), and age (in years). The researchers in the study hypothesized that experiences of everyday discrimination related to gender would be associated with depression, such that women who experienced more gender discrimination would be more depressed than women who experienced less discrimination. They also hypothesized that experiences of discrimination would be greater among women of low SES than middle or upper class women Create an EXCEL XLS and also a CVS data file containing the following dita. Be sure to enter the data so chat each participant's data is represented by one line in the data set and each variable is represented by a column the data set. Open the CVS file with JASP and make sure you designate SES as an ordinal variable and provide value labels. [Your final data file should include five columns and 45 rows] ID 16 Low SES Discrim 2.4 25 11 10 1 2 3 Age 40 Age 58 19 AR 39 Depress 28 14 12 17 49 29 25 5 6 58 JT 0.6 3 1.1 Depress 1A 22 12 12 13 6 60 6 19 22 3 8 Middle SES Discrim 2.48 115 1.35 0.62 1.71 0.46 2.19 027 0.18 1.75 1.23 0.78 0.51 0.93 2.4 18 19 2 32 3 2 44 22 23 58 1.2 18 29 10 54 11 38 78 13 28 6 0.7 19 35 2732 28 23 29 47 3028 5 5 14 15 0.9 7 10 Age Disc 24 17 299 37 40 DERRNER Depress 20 19 20 31 10 LI 1.53 20 23 36 0.0 TE 9 38 39 40 20 35 30 23 22 20 25 27 1.97 2.25 2.43 2.58 2.79 1.91 1.63 2.07 42 16 21 10 14 15 15 10 43 44 45 ANALYSES TO BE CONDUCTED IN JASP and EXCEL 1. Obtain the appropriate descriptive statistics for all 4 variables in the study. a. Generate a frequency table, request the mean, median, mode, standard deviation, and range for age, discrimination, depression and SES. Insert the table b. Does this make sense for all four variables? c. Split by SES. Create the appropriate tables and insert them 2. Generate graphs for the appropriate variables.. a. Generate frequency histograms for age, discrimination, and depression. Insert them. b. Generate box and whisker plots for discrimination and for depression using SES on the category axis (X axis). Insert them. c. Generate a scatter plot (in the Excel XLS file) with depression on the Y axis and discrimination on the X axis. Insert it, 3. Standardize the scores on depression using 2-Scores a. Use EXCEL to compute standardized values for depression. Use these 2-scores to answer question 7 below. WRITTEN PORTION Clype your responses using 12 point Times New Roman font) 1. In your own words, write a paragraph describing the variables in the study. Given the hypotheses, which variable is the PRIMARY dependent variable? Which is the PRIMARY independent variable? What types of scales do the variables seem to be measured on (nominal, ordinal, interval, or ratio) 2. Report the mode for SES, and the mean, median, mode, standard deviation, and range for age discrimination, and depression. 3. Write a paragraph describing the distributions of age, discrimination, and depression within this sample. In your description, be sure to discuss the shape, center, and spread of the distributions. 4. The measure of depression used in the study was constructed such that a score of 21 or higher indicated clinically diagnosable depression. Using this criteria and referring back to your data, what percentage at women in the sample met criteria for clinically diagnosable depression? 5. Compare the box and whisker plots that you generated in 2b. Do the data support the researchers hypothesis that low SES women would experience more discrimination than middle and high SES women? Write a few sentences to explain your position. Provide a theoretical conceptual reason why you think the data show the pattern you observed, 6. Based on the scatter plot generated in 2e, what do you conclude regarding the researchers' hypothesis that women who experienced more discrimination would be more depressed than women who experienced less discrimination? Write a few sentences to explain your conclusions. Provide a theoretical/conceptual reason why you think the data show the pattern you observed 7. Based on the standardized scores, are there any extreme scores among the women in the study regarding depression? If so, identify the criteria you are using to identify extreme scores and list the ID numbers for those women. Given the pattern observed in 2c, what would you expect their 2-scores for lool lillah to the datamine the extreme ces case by Do the Assignment_1.doc $ Help Unsaved changes Edits will not be automatically saved. Save now Download Times New LAUREA Normal BIV A. A The following data are from a study of gender-related discrimination and mental health. The participants in the study were women between the ages of 18-59. The data were collected by trained interviewers within the context of a clinical interview, which contained measures of depression (0-60; higher scores = more depression), everyday experiences of discrimination (0-3; higher scores = more experiences of discrimination), SES (1 = low, 2 = middle, 3 = high), and age (in years). The researchers in the study hypothesized that experiences of everyday discrimination related to gender would be associated with depression, such that women who experienced more gender discrimination would be more depressed than women who experienced less discrimination. They also hypothesized that experiences of discrimination would be greater among women of low SES than middle or upper class women. Create an EXCEL XLS and also a CVS data file containing the following data. Be sure to enter the data so that each participant's data is represented by one line in the data set and each variable is represented by a column in the data set. Open the CVS file with JASP and make sure you designate SES as an ordinal variable and provide value labels. [Your final data file should include five columns and 45 rows] ID 1 Age 40 ID 16 17 18 Depress 26 14 12 2 Middle SES Discrim 2.48 115 1.35 0.62 49 Age 58 19 48 39 52 58 37 3 Low SES Discrim 2.4 25 11 08 08 0 3 11 Depress 18 22 12 12 13 6 60 4 19 20 5 6 25 4 44 2 32 2 Gordon Written Lab Assignment_1.doc eFdFormatTools Help Unsaved changes Luis will not be cally saved. Suve Times New 12 BIA JE E ID Age 31 32 33 40 37 40 40 20 33 High SES Discrim 2.48 1.7 2.89 1.97 1.53 1.57 0.07 Depress 20 19 20 31 10 11 34 35 36 37 143 9 38 20 39 35 40 30 41 23 42 22 43 20 25 45 27 1.97 2.25 2.43 2.58 2.79 191 1.63 9 16 21 10 14 15 15 2.07 10 ANALYSES TO BE CONDUCTED IN JASP and EXCEL 1. Obtain the appropriate descriptive statistics for all 4 variables in the study. a. Generate a frequency table, request the mean, median, mode, standard deviation, and range for Unsaved changes 12 TA EE we wataset opene sme WDASE MAKE SURE your design as dit onde van de provide value labels. [Your final data file should include five columns and 45 rows] ID 1 LOW SES Discrim 2.4 Age 58 19 ID Depress 16 Depress 18 22 12 Age 40 49 26 N 2.5 14 3 48 1.1 17 18 19 12 4 39 0.8 12 42 29 25 5 0.8 13 20 6 52 58 37 0.6 6 21 47 19 2 32 7 3 44 60 6 Middle SES Discrim 2.48 1.15 1.35 0.62 1.71 0.46 2.19 0.27 0.18 1.75 1.23 0.78 0.51 0.93 2.4 22 23 B 18 58 1.1 1.2 9 29 19 35 24 25 10 54 1.7 22 19 6 8 38 0.7 3 26 11 12 13 28 1.3 9 27 35 32 23 2.4 13 28 5 28 29 14 29 47 14 1.4 0.9 14 7 15 47 30 28 25 ID Age 40 High SES Discrim 2.48 31 32 Depress 20 19 20 1.7 28 a. Use EXCEL to compute standardized values for depression. Use these z-scores to answer question 7 below. WRITTEN PORTION (Type your responses using 12 point Times New Roman font) 1. In your own words, write a paragraph describing the variables in the study. Given the hypotheses, which variable is the PRIMARY dependent variable? Which is the PRIMARY independent variable? What types of scales do the variables seem to be measured on (nominal, ordinal, interval, or ratio)? 2. Report the mode for SES, and the mean, median, mode, standard deviation, and range for age, discrimination, and depression. 3. Write a paragraph describing the distributions of age, discrimination, and depression within this sample. In your description, be sure to discuss the shape, center, and spread of the distributions. 4. The measure of depression used in the study was constructed such that a score of 21 or higher indicated clinically diagnosable depression. Using this criteria and referring back to your data, what percentage of women in the sample met criteria for clinically diagnosable depression? 5. Compare the box and whisker plots that you generated in 2b. Do the data support the researchers hypothesis that low SES women would experience more discrimination than middle and high SES worpen? Write a few sentences to explain your position. Provide a theoretical/conceptual reason why you think the data show the pattern you observed. 6. Based on the scatter plot generated in 2e, what do you conclude regarding the researchers' hypothesis that women who experienced more discrimination would be more depressed than women who experienced less discrimination? Write a few sentences to explain your conclusions. Provide a theoretical/conceptual reason why you think the data show the pattern you observed. 7. Based on the standardized scores, are there any extreme scores among the women in the study regarding depression? If so, identify the criteria you are using to identify extreme scores and list the ID numbers
Step by Step Solution
There are 3 Steps involved in it
1 Expert Approved Answer
Step: 1 Unlock

Question Has Been Solved by an Expert!
Get step-by-step solutions from verified subject matter experts
Step: 2 Unlock
Step: 3 Unlock