

Question: using matlab PROBLEM 2 (10 points) Plot the function f(x) = -3x+2 for -1 5 x 55 in a Figure 3. Add a plot title
using matlab 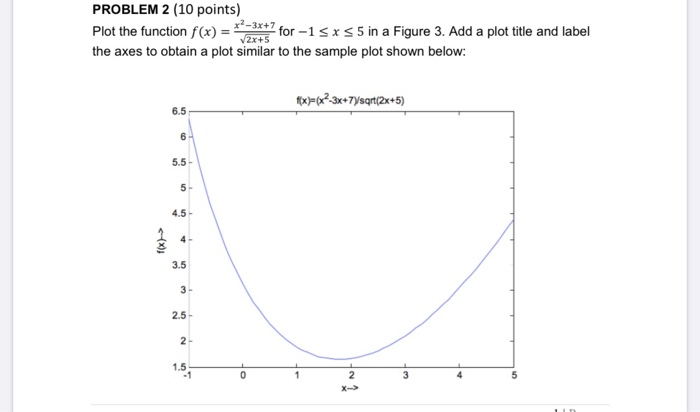
PROBLEM 2 (10 points) Plot the function f(x) = -3x+2 for -1 5 x 55 in a Figure 3. Add a plot title and label the axes to obtain a plot similar to the sample plot shown below: f(x)=(x-3x+7Ysqrt(2x+5)
Step by Step Solution
There are 3 Steps involved in it
1 Expert Approved Answer
Step: 1 Unlock

Question Has Been Solved by an Expert!
Get step-by-step solutions from verified subject matter experts
Step: 2 Unlock
Step: 3 Unlock